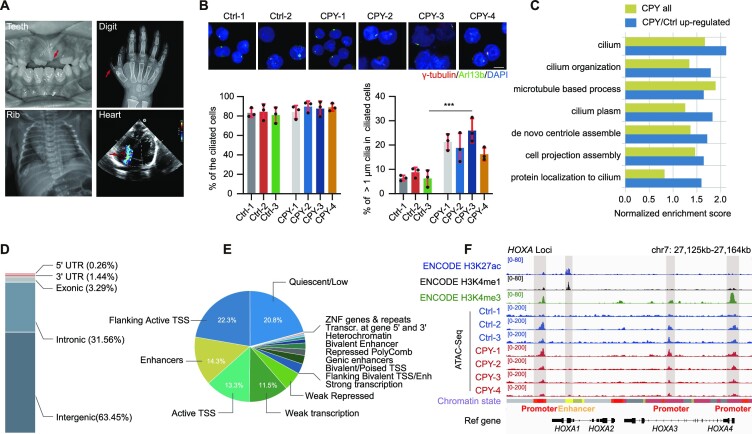
Figure 1.
Open chromatin landscape remodelling occurs in EVC ciliopathy patients. (A) Oral, skeletal and radiological results displaying the characteristics of EVC ciliopathy. (B) Immunostaining of γ-tubulin (red) and Arl13b (green) in PBMCs of normal individuals (Ctrl) and EVC-associated ciliopathy patients (CPY). DNA was stained with DAPI (blue) (upper). Quantification of the percentage of ciliated cells (lower left) and cilia > 1 μm in ciliated cells (lower right). ***P < 0.001, as determined using Student's t-test. Scale bars, 2 μm. (C) Cilia-related GO term enrichment scores within EVC ciliopathy and up-regulated EVC ciliopathy genes from the transcriptome dataset. (D) Annotations of the genomic distribution of all peaks identified using ATAC-seq. UTR, untranslated region. (E) Annotations of all open chromatin regions presenting the chromatin states trained using public data of PBMCs from the ENCODE project. TSS, transcription start site. (F) The IGV snapshot displaying the H3K27ac, H3K4me1 and H3K4me3 signals of PBMCs from ENCODE, and ATAC-seq signals of PBMCs in HOXA gene loci. Vertical grey boxes indicate enhancer and promoter ATAC-seq signals. Chromatin states are obtained from ENCODE (red, active promoter; yellow, weak enhancer; orange, strong enhancer; green, transcribed region; and grey, heterochromatin).

