Figure 6.
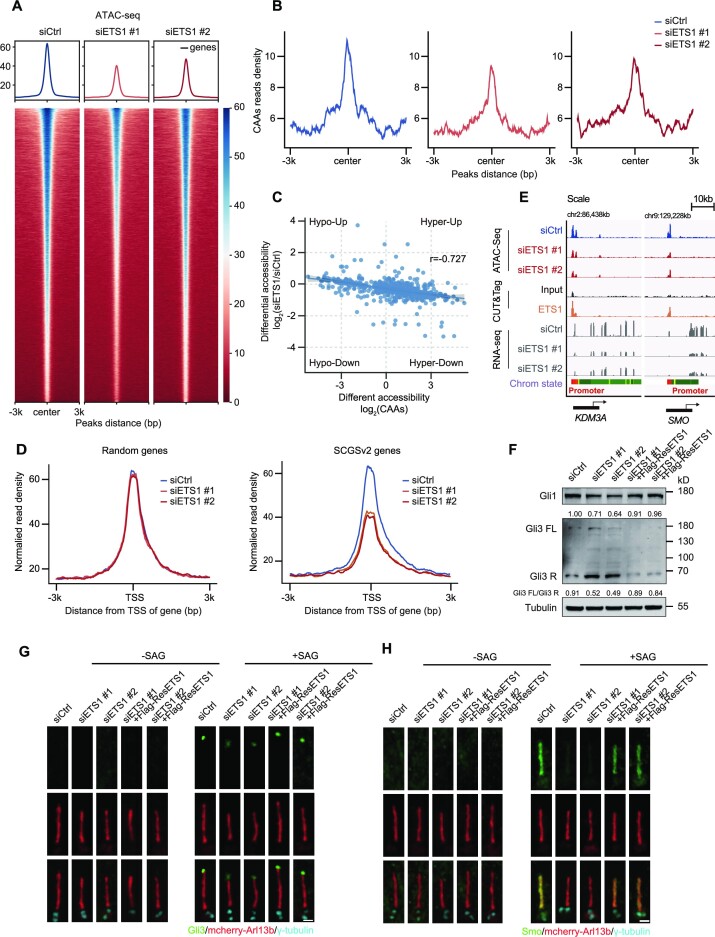
ETS1 loss induces aberrant expression of cilia genes by remodelling the signals of flanking CAAs. (A) Heatmaps and enrichment plots showing normalized read densities of ATAC-seq signals after down-regulation of ETS1 expression in hTERT RPE-1 cells. Tracks are centred at the peaks and extend ± 3 kb. (B) The enrichment of ATAC-seq signals at CAAs after down-regulation of ETS1 expression in control (siCtrl) and ETS1-depleted (siETS1) hTERT RPE-1 cells. Tracks are centred at the peaks and extend ± 3 kb. (C) Spearman's correlation of CAA accessibility changes and regions that close after ETS1 suppression in hTERT RPE-1 cells (r = –0.727). (D) Enrichment plots showing normalized read densities of ATAC-seq signals from hTERT RPE-1 cells at the TSS for randomly selected genes (n = 700, left) and SCGSv2 genes (right) after ETS1 knockdown. Tracks are centred at the TSS and extend ± 3 kb. (E) IGV snapshot showing the ATAC-seq, CUT&Tag and RNA-seq signals from hTERT RPE-1 cells in loci of KDM3A and SMO genes. (F) Immunoblots of Gli1 and Gli3 in control (siCtrl), ETS1-depleted (siETS1) and ETS1-rescued (siETS1 + Flag-ResETS1) hTERT RPE-1 cells. The intensity of Gli1 and the ratio of Gli3-FL/Gli3-R was quantified. Tubulin was used as a loading control. (G and H) Immunostaining of Gli3 (green) (G) or Smo (green) (H) and γ-tubulin (cyan) in control, ETS1-depleted and ETS1-rescued hTERT RPE-1 cells transfected with mCherry–Arl13b (red) with (right) or without (left) Smoothened agonist (SAG). Scale bars, 1 μm.

