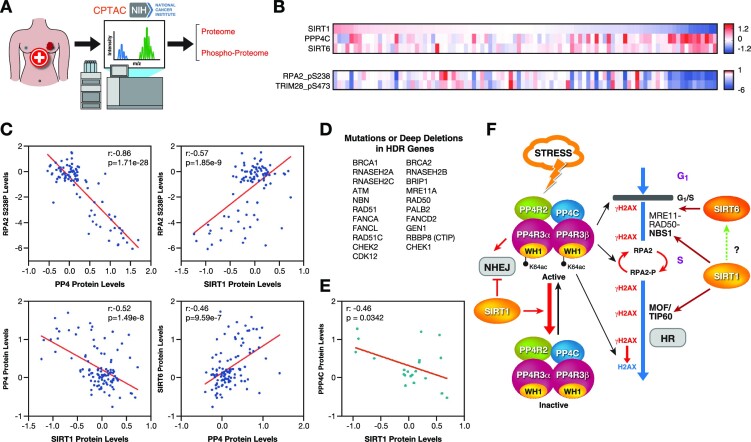
Figure 7.
SIRT1 and PP4 inversely correlate in cancer. (A) Proteomics and phosphoproteomics data from tumor samples was obtained from the National Cancer Institute's Clinical Proteomic Tumor Analysis Consortium (CPTAC) analysis of tissues from the Breast Invasive Carcinoma (TCGA) dataset. (B) Heatmap of SIRT1, SIRT6, PPP4C protein abundance and pRPA2 (p238) and pTRIM28 (pS473) levels in samples from the study described in (A). Each column corresponds to one tumor sample. (C) Correlations between the indicated proteins and pRPA2 in each tumor sample were analyzed. Pearson correlation coefficient (r) and P-value (P) for each analysis are shown. (D) List of HDR-associated genes used in the analysis of (E). (E) Samples of the breast cancer cohort containing mutations or deep deletions in the genes in (D) were selected and analyzed as in (C). (F) Proposed model of the antagonistic interplay between SIRT1 and PP4 in HR repair.

