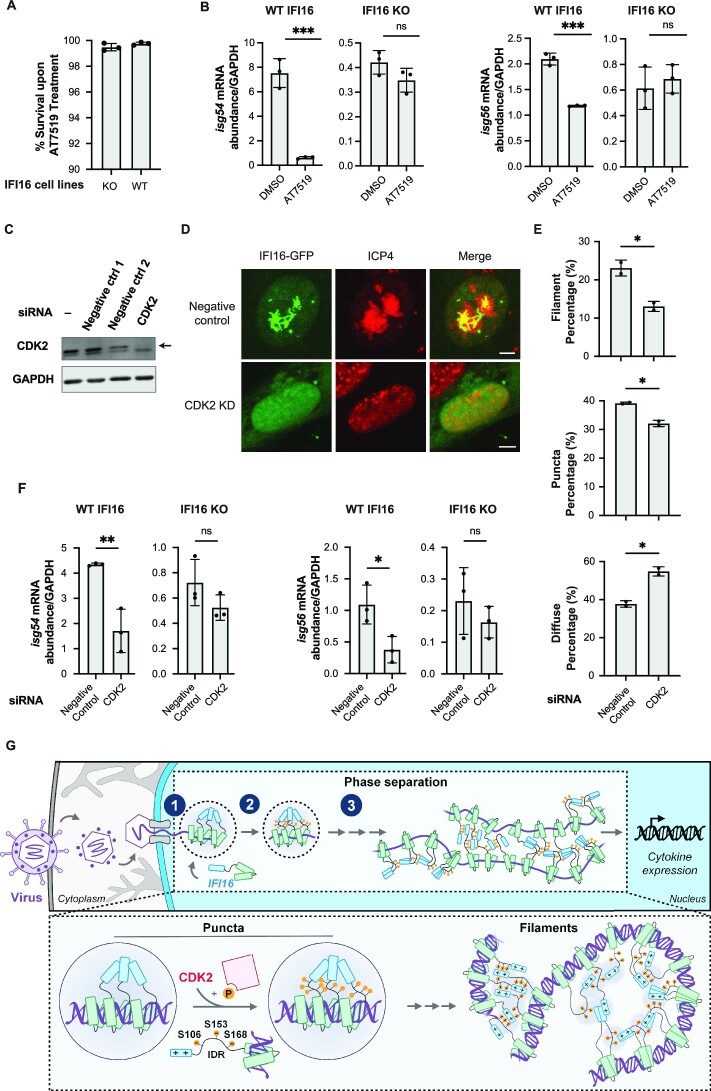
Figure 7.
CDK2 knockdown led to reduced IFI16 LLPS and dampened IFI16-dependent cytokine induction. (A) Percentage cell survival of HFFs after AT7519 treatment at 5 μM for 6 h. Cell apoptosis was measured using TUNEL assays that measure PARP cleavage, a signature of apoptotic signaling. (B) Relative mRNA levels (means ± SEMs, n = 3) of isg54 and isg56 in IFI16-KO HFF stable cell lines or scrambled-KO HFFs infected with ICP0-RF HSV-1 (MOI = 5) and treated with DMSO or 5 μM AT7519, measured by RT-qPCR at 6 hpi. Statistical analysis was performed using unpaired t-test. Values are means ± SEMs (n = 3). (C) Western blot images of indicated samples blotting for CDK2 and GAPDH following siRNA-mediated knockdown in WT HFFs. (D) Representative confocal images of IFI16-GFP stably expressing HFFs infected with ICP0-RF HSV-1 (MOI = 10) at 8 hpi after negative control or CDK2 knockdown and stained for ICP4. Scale bar, 5 μm. (E) Quantification of percentage of cells (N > 100) displaying puncta, filament or diffuse phenotype for conditions described in (D). Values are means ± SEMs (n = 2). (F) Relative mRNA levels (means ± SEMs, n = 3) of isg54 and isg56 in IFI16-KO HFF stable cell lines or scrambled-KO HFFs infected with ICP0-RF HSV-1 (MOI = 5) after negative control or CDK2 knockdown, measured by RT-qPCR at 6 hpi. Statistical analysis was performed using unpaired t-test. Values are means ± SEMs (n = 3). (G) Model for IFI16 LLPS in immune activation. IFI16 molecules first bind to viral DNA at the nuclear periphery, giving rise to puncta. CDK2 phosphorylates IFI16 IDR at S106, S153 and S168, facilitating LLPS of IFI16. As infection progresses and IFI16 expression increases, IFI16 transitions from a punctate state to solid filamentous state, which is mediated by interactions between positively charged residues within PY and phosphorylated residues within IDR. Finally, LLPS of IFI16 activates downstream signaling pathways to promote cytokine induction.

