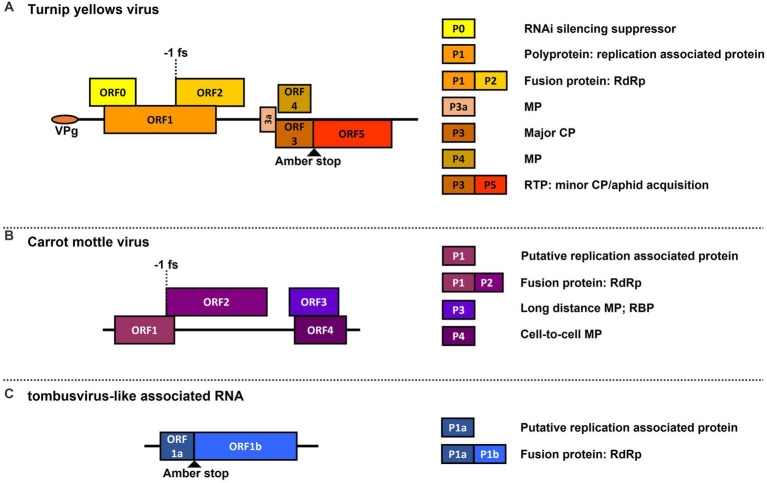
Figure 1.
Genome maps of viruses used in this study. Depicted are graphical representations of: (A) the polerovirus turnip yellows virus (TuYV); (B) the umbravirus carrot mottle virus (CMoV); and (C) a general representation of tombusvirus-like associated RNA (tlaRNA) genome structure. Diagrams are drawn to scale. Solid black lines depict the length of the viral RNA genome. Boxes indicated the open reading frames (ORFs) encoded by each virus, and their positions in relation to the solid black line indicate in which reading frame register (RFR) they occur (Above the line: RFR1; on the line: RFR2; beneath the line: RFR3). Key translation features such as amber stop codons used for translational readthrough and −1 frameshift sites are depicted. The boxes to the right of the genome indicate the known functions of proteins encoded by the corresponding ORFs depicted in the viral genomes. RNAi, RNA interference; RdRp, viral replicase protein; MP, movement protein; CP, capsid protein: RTP, readthrough protein; RBP, RNA binding protein.

