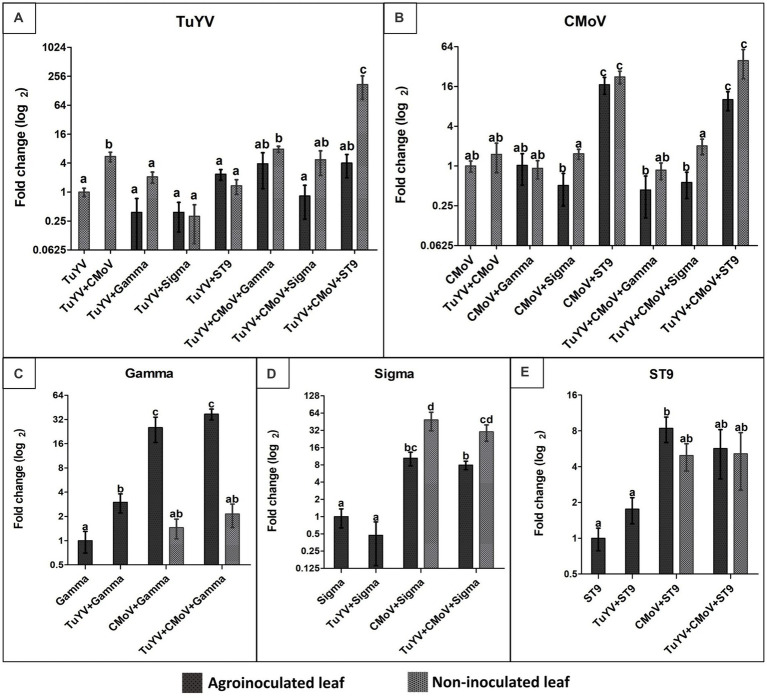
Figure 5.
Relative accumulation of TuYV, CMoV, and tlaRNAs Gamma, Sigma, and ST9 as a function of co-infection. Graphs depict log2 changes in viral accumulation of (A) TuYV, (B) CMoV, and the tlaRNAs (C) Gamma, (D) Sigma, and (E) ST9 in mixed infections relative to accumulation of each of these viruses in single infections; the y-axis. Virus accumulation was quantified using RT-qPCR and calculated using the 2–∆∆ Ct method. Black and gray bars represent relative viral accumulation in agroinoculated and non-inoculated leaves, respectively. Graphs depict the means ± SEs. Significant differences between treatments were determined using ANOVA with a significance value of p < 0.05; different letters indicate significant differences between treatments, whereas shared letters indicate there was not a significant difference between treatments.

