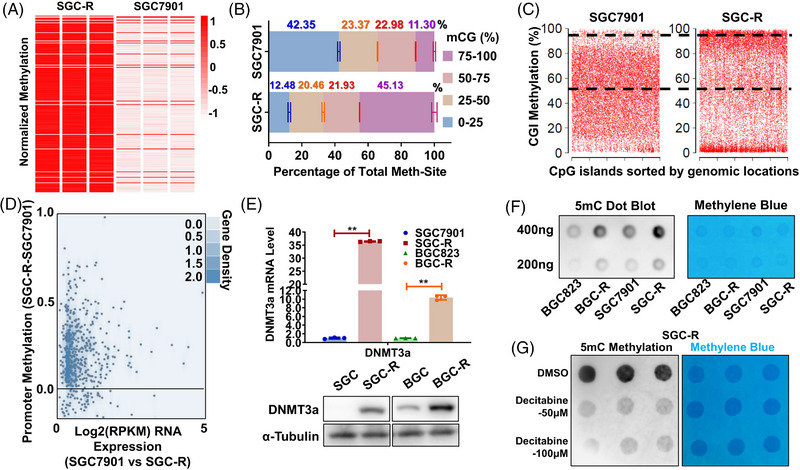
FIGURE 2.

Differential DNA methylation occurs in chemoresistance GC cells. (A) A heat map of global DNA methylation level for chemosensitive (SGC7901) and chemoresistant (SGC‐R) cells using MethylationEPIC BeadChip. All methylated genes were ordered randomly. (B) A global view of DNA methylation in SGC7901 and SGC‐R. A cumulative bar plot shows the proportions at four methylation levels (0%−25%, 25%−50%, 50%−75% and 75%−100%). mCG means CG methylation. (C) The scatter plot of CGI methylation in the Control and EBSS group. The percentages of CGIs with methylation levels greater than 50% are indicated with dotted lines. (D) Plot of the changes of promoter methylation against the average gene expression between SGC7901 and SGC‐R. (E) The expression of DNMT3a in chemosensitive or resistant SGC7901 and BGC823 cells was detected by qRT‐PCR and WB. Data were presented as the mean ± SD, n = 3. **p < .01 (Student's t‐test). (F) Detection of overall DNA methylation levels by DNA dot blot with antibodies specific for 5‐mC in chemosensitive or resistant SGC7901 and BGC823 cells. The grey values indicate DNA methylation levels and the blue one shows the result of methylene blue staining as DNA internal reference. (G) Dot blot of DNA isolated from DMSO and Decitabine (reduce levels of DNA methylation) treatment in SGC‐R cells is performed to testify the global DNA methylation level.
