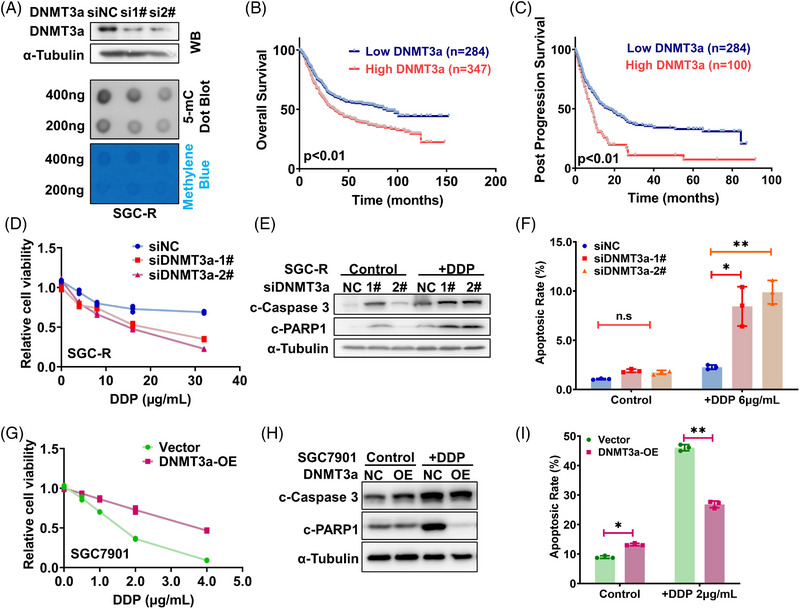
FIGURE 3.

DNMT3a induces differential DNA methylation in chemoresistance cells. (A) DNMT3a was knocked down in SGC‐R and the efficiency is assessed by WB. Dot blot of DNA isolated from indicated groups is operated to identify global DNA methylation level. (B, C) The Kaplan–Meier curve analysis on the impact of DNMT3a expression on overall survival (B) and post progression survival (C). p Value was calculated by the Log Rank test. (D) Effect of DNMT3a knockdown in SGC‐R on the viability of resistant cells with or without DDP treatment for 24 h was detected using MTS assay. Experiments were all repeated three times and the representative data were shown. (E, F) SGC‐R cells transfected with negative control (siNC) or DNMT3a siRNAs were treated with or without DDP (5 μg/mL) for 24 h and dynamic apoptosis rate was measured using WB (E) as well as flow cytometry (F). (G) Effect of DNMT3a overexpression in SGC7901 on the viability of sensitive cells with or without DDP treatment for 24 h was detected using MTS assay. (H, I) SGC7901 cells transfected with empty or DNMT3a overexpression vector were treated with or without DDP (2 μg/mL) for 24 h and dynamic apoptosis rate was measured using WB (H) as well as flow cytometry (I).
