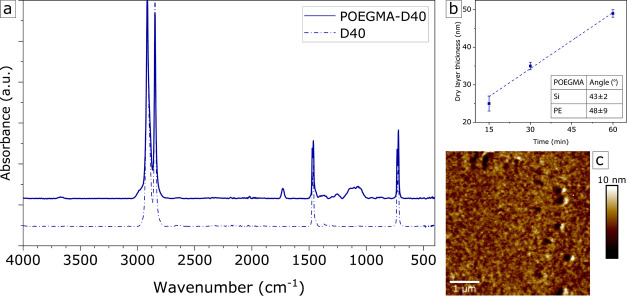
Figure 6.
(a) FTIR spectrum of D40 (dashed) and POEGMA–D40 (solid) on HDPE. Functional groups present are as follows: −CH2– backbone at ∼2990 cm–1, C=O ester at ∼1750 cm–1, −O–H ethylene glycol chain end at ∼1410 cm–1, −C–O– ethylene glycol chain at ∼1250–1000 cm–1. (b) Grafted POEGMA film dry thickness (nm) as a function of polymerization time (min). Inset: The static contact angle values for POEGMA on Si and PE. (c) AFM height map of MIDOMA–D40 + grafted POEGMA.

