
Figure 5.
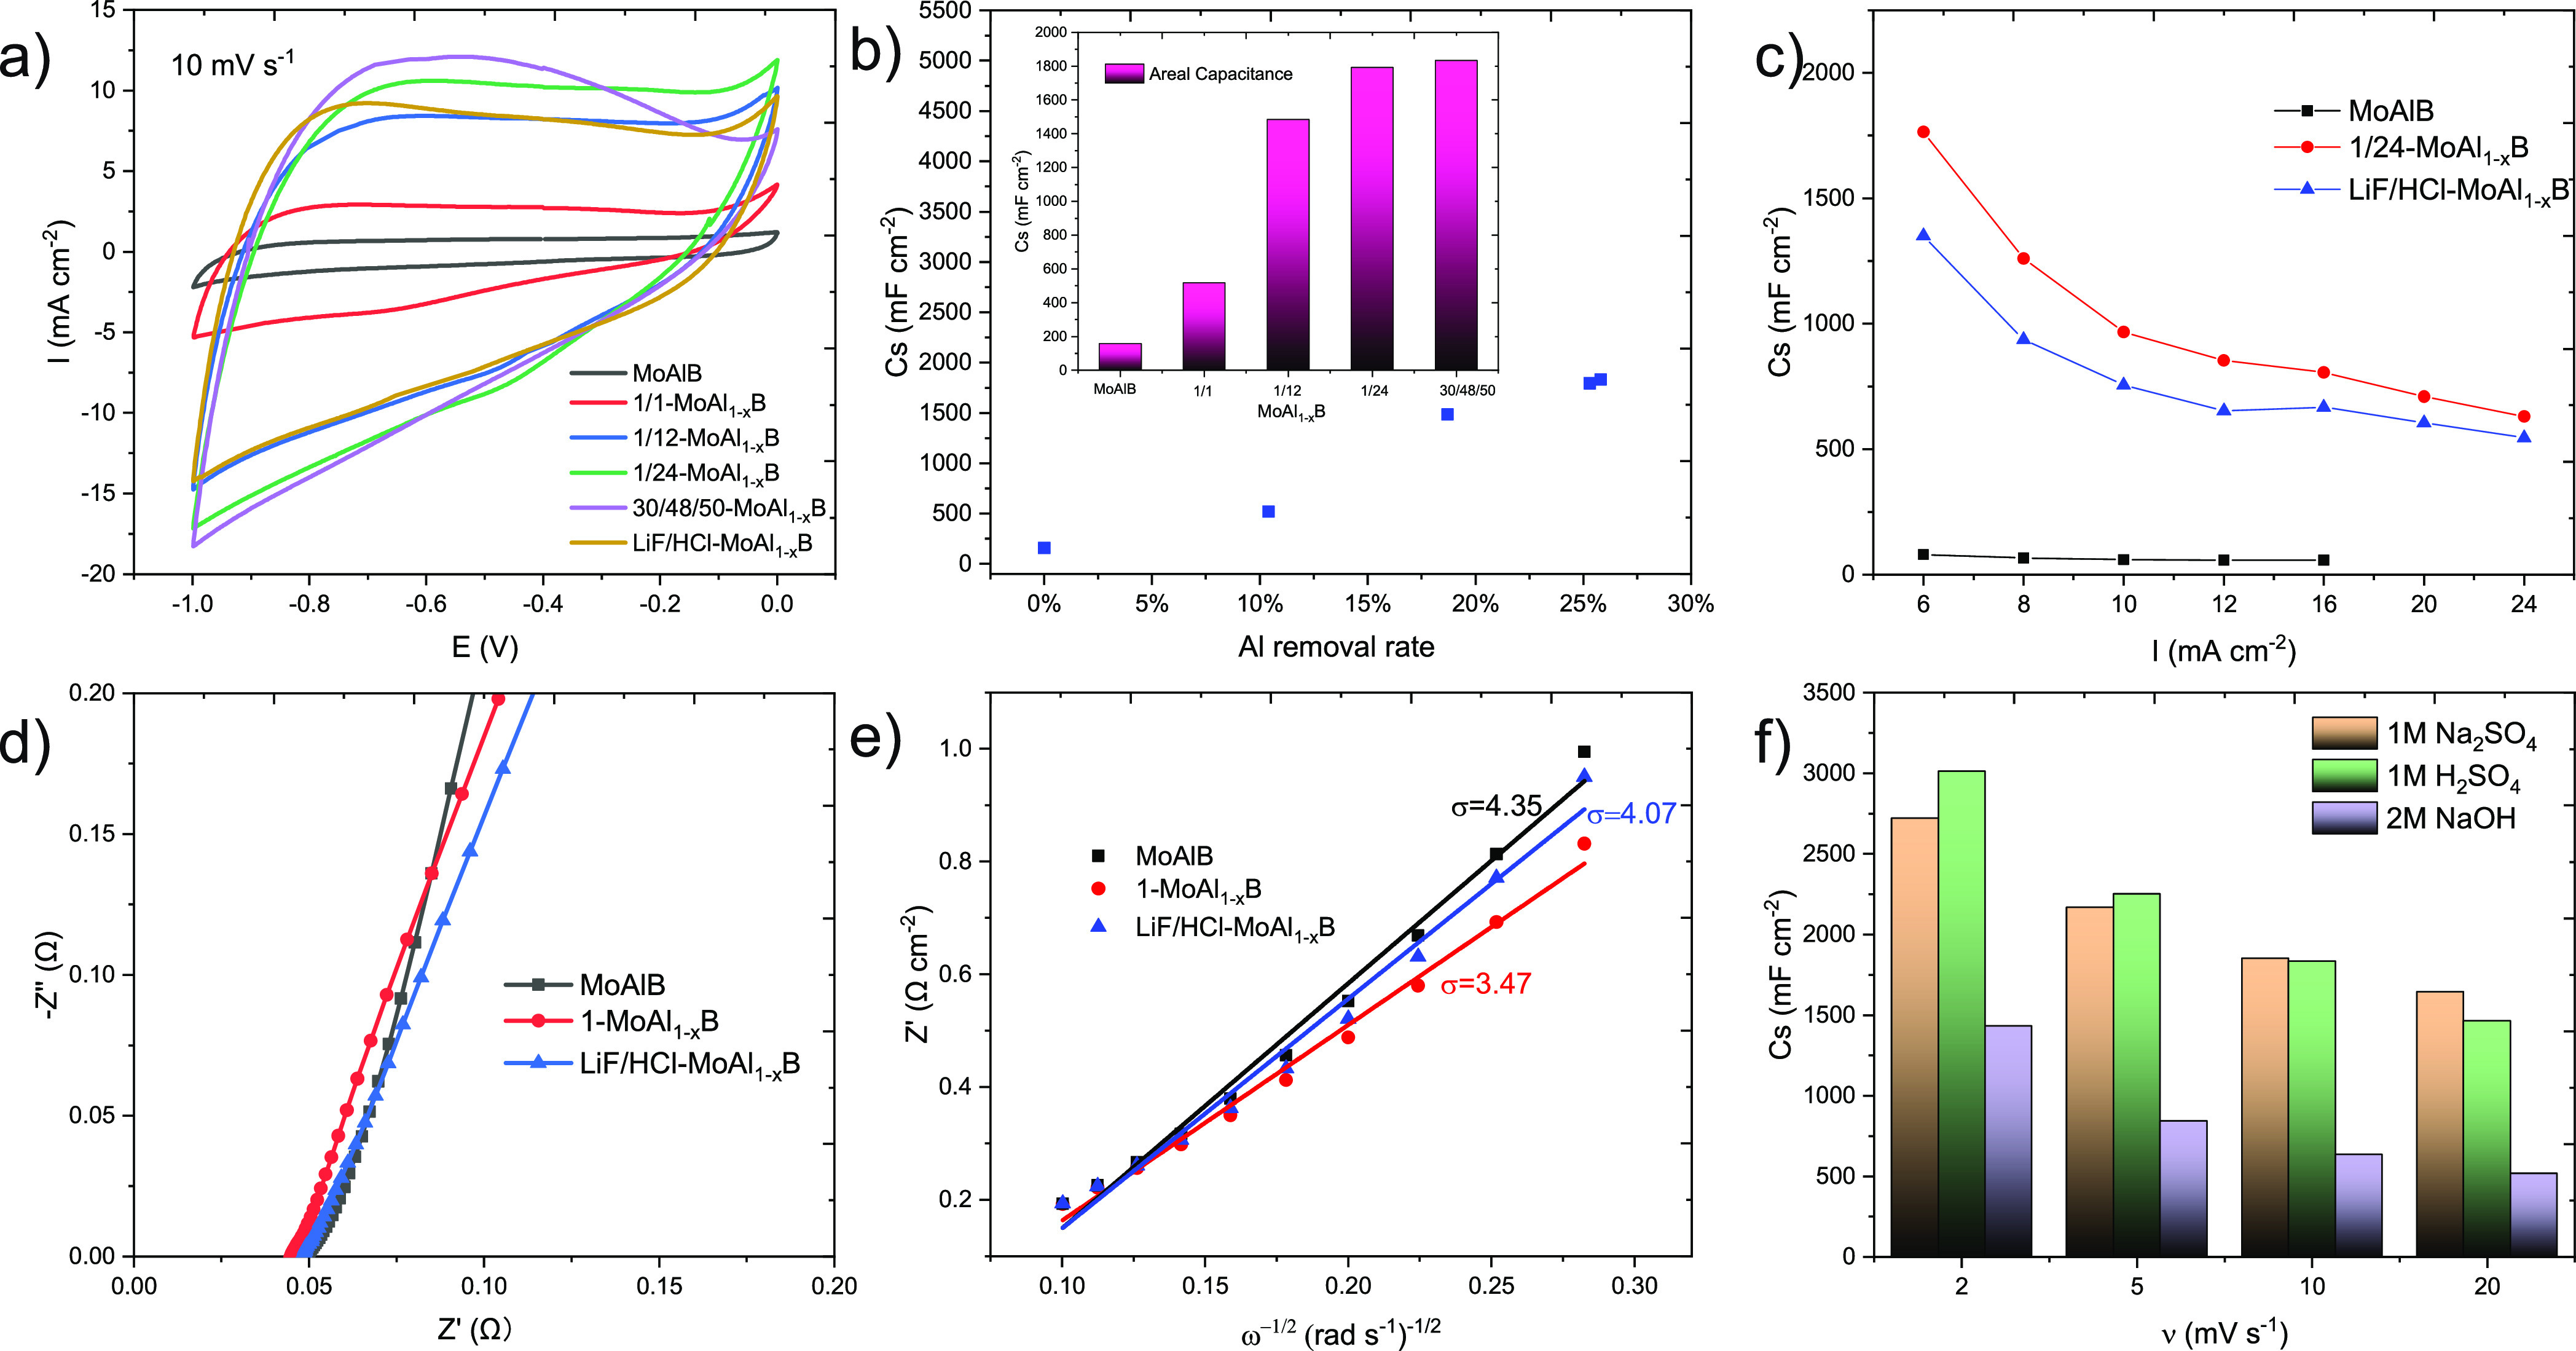
Electrochemical measurements in 3-electrode setup: (a) CV curves for MoAlB and MoAl1–xB at scan rate 10 mV s–1 in 1 M Na2SO4; (b) variation of areal capacitance of MoAl1–xB with Al removal rate (10 mV s–1, NaOH etching only), insert is the detailed capacitance values; (c) areal capacitance for MoAlB, 1/24-MoAl1–xB, and LiF/HCl-MoAl1–xB at different charge–discharge speeds; (d) Nyquist plots for MoAlB, 1/24-MoAl1–xB, and LiF/HCl-MoAl1–xB; (e) the fitted lines between Zre and ω–1/2 for MoAlB, 1/24-MoAl1–xB, and LiF/HCl-MoAl1–xB; (f) areal capacitance of 1/24-MoAl1–xB in 1 M Na2SO4, 1 M H2SO4, and 2 M NaOH.