
Table 2. Sensing Parameters of Different CO2 Sensors Based on MOX Semiconductors.
| sensing material | synthesis route | operating temperature [°C] | response at concentration [ppm] | operating condition | reference |
|---|---|---|---|---|---|
| ZnO/CuO nanorods | hydrothermal | RT | 0.09 at 1000a | dry | (16) |
| 5wt%Sn-CdO nanopowders | co-precipitating | 250 | 1.18 at 5000b* | dry | (17) |
| CuO@1wt%Ag-BaTiO3 spheres decorated | mixing | 120 | 0.60 at 1000a* | dry | (18) |
| CeO2 yolk-shell nanospheres | solvothermal | 100 | 3.98 at 2400c | negligible response below 70 RH% | (19) |
| Nd2O2CO3 nanoparticles | sol–gel | 350 | 4.00 at 1000d | negligible response below 50 RH% | (20) |
| CaO-In2O3 mesoporous | impregnation | 230 | 1.80 at 2000d | dry | (21) |
| N-ZnO nanoparticles | sol–gel | 250 | 4.50 at 2000d* | dry | (61) |
| Na:In2O3 nanoparticles | sol–gel | 200 | 7.10 at 1000e | uniform response above 15 RH% | this work |
a
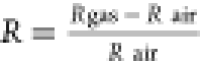 , where R is the resistance
(Rgas, resistance in CO2 atmosphere; Rair, resistance in carrier gas). The asterisk
denotes a value not explicitly stated in the study but approximated
from a graphical plot.
, where R is the resistance
(Rgas, resistance in CO2 atmosphere; Rair, resistance in carrier gas). The asterisk
denotes a value not explicitly stated in the study but approximated
from a graphical plot.
b
 , where R is the resistance
(Rgas, resistance in CO2 atmosphere; Rair, resistance in carrier gas).
, where R is the resistance
(Rgas, resistance in CO2 atmosphere; Rair, resistance in carrier gas).
c
 , where R is the resistance
(Rgas, resistance in CO2 atmosphere; Rair, resistance in carrier gas).
, where R is the resistance
(Rgas, resistance in CO2 atmosphere; Rair, resistance in carrier gas).
d
 , where R is the resistance
(Rgas, resistance in CO2 atmosphere; Rair, resistance in carrier gas). The asterisk
denotes a value not explicitly stated in the study but approximated
from a graphical plot.
, where R is the resistance
(Rgas, resistance in CO2 atmosphere; Rair, resistance in carrier gas). The asterisk
denotes a value not explicitly stated in the study but approximated
from a graphical plot.
e
 , where G is the conductance
(Ggas, conductance in CO2 atmosphere; Gair, conductance in carrier gas).
, where G is the conductance
(Ggas, conductance in CO2 atmosphere; Gair, conductance in carrier gas).