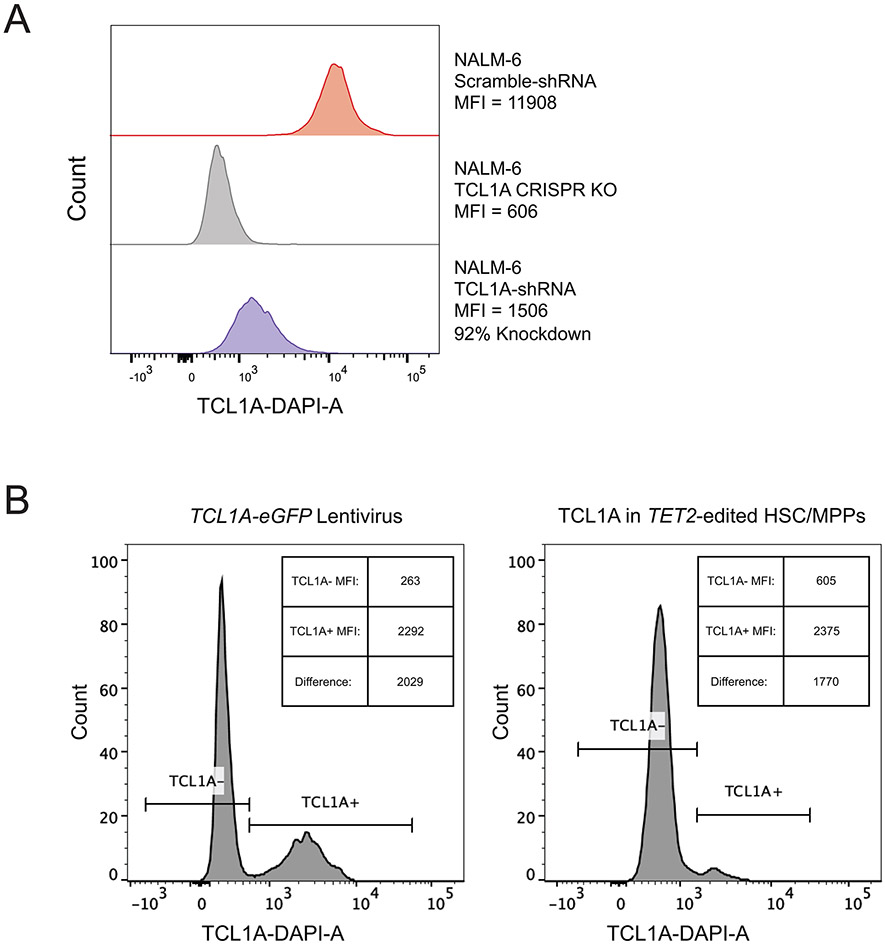
Extended Data Fig 8∣. Validation of TCL1A shRNA and Expression Lentivirus.
A. Histogram of TCL1A-DAPI in wild-type, TCL1A CRISPR knockout, and TCL1A shRNA knockdown in NALM-6 cell line. B. Histogram of TCL1A-DAPI in human HSC/MPPs transduced with TCL1A-eGFP lentivirus or TET2-edited HSC/MPPs. MFI = geometric mean fluorescence intensity.

