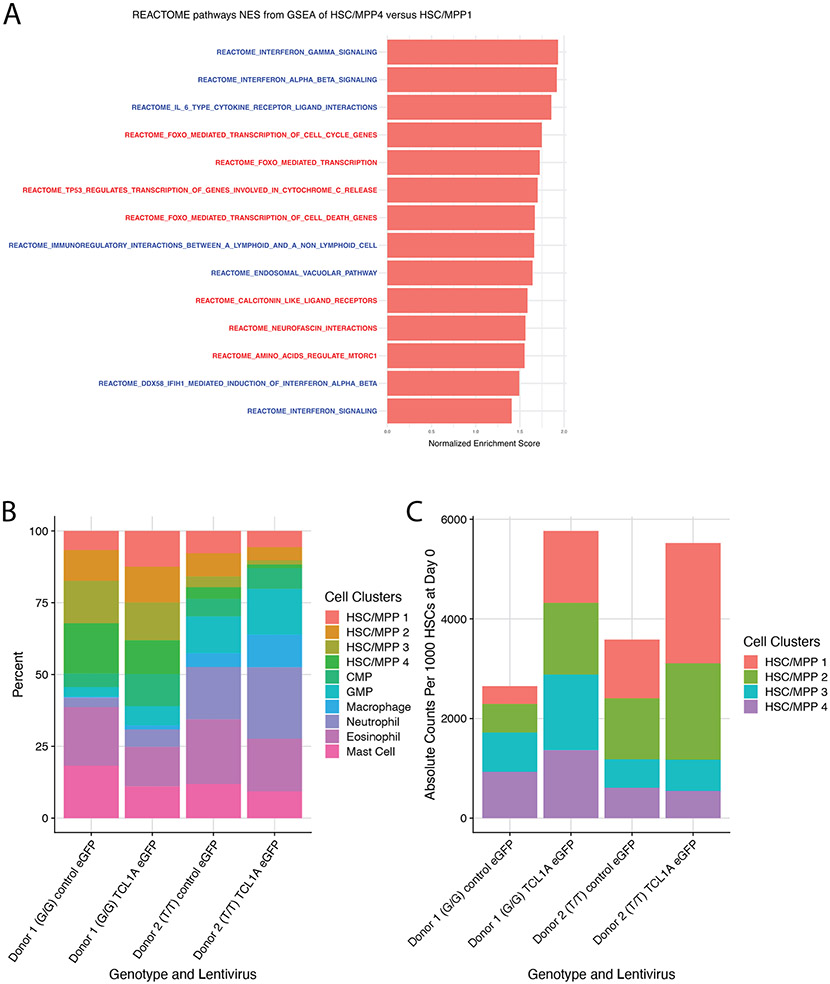
Extended Data Fig 11∣. Effect of TCL1A Expression on Human HSC/MPP Phenotypes.
A. Normalized enrichment scores (NES) of REACTOME pathways upregulated in HSC/MPP cluster 4 compared to HSC/MPP cluster 1 and filtered for those with FDR<0.1 and NES>1. Pathways printed in blue contain interferon response genes and pathways printed in red contain FOXO response genes. B. Stacked bar plot of all clusters in each analyzed sample dataset as a percentage of total cells in that sample. G/G or T/T refers to the genotype at rs2887399 in the donor. C. Stacked bar plot of absolute counts for each HSC/MPP cluster from each sample. Counts are shown as number of output cells at Day 7 per 1000 HSC/MPPs plated at Day 0.

