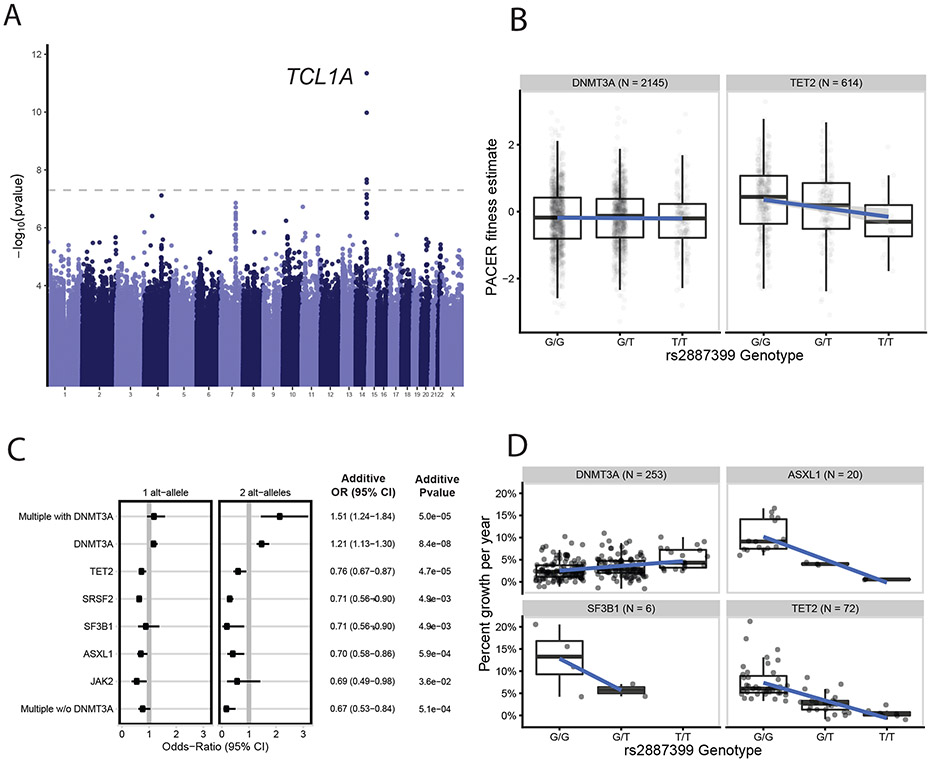
Fig 2∣. GWAS of PACER Identifies Germline Determinants of Clonal Expansion in Blood.
A, A genome-wide association study (GWAS) of passenger counts identifies TCL1A as a genome-wide significant locus. Test statistics were estimated with SAIGE61. B, The association between the genotypes of rs2887399 and PACER varied between TET2 and DNMT3A. Alt-alleles were associated with decreased PACER score in TET2 mutation carriers, but no association was observed in DNMT3A carriers. C, The association between alt-alleles at rs2887399 and presence of specific CHIP mutations varies by CHIP mutations (n = 5,071 CHIP carriers). Forest plot shows the odds ratios for having specific mutations in those carrying a single T-allele and two T-alleles, respectively. Odds ratios were estimated using Firth logistic regression, with error bars representing 95 percent confidence intervals. On the right of the forest plot, effect estimates and p-values are included from SAIGE, which uses an additive coding of the alt-alleles for hypothesis testing and uses a generalized linear mixed model to estimate test statistics. Unadjusted, two-sided p-values are reported. In the additive tests, SF3B1 and SRSF2 were grouped together to aid convergence. D, The association between the genotypes of rs2887399 and percent growth per year of CHIP clones from 351 carriers in the Women’s Health Initiative. Percent growth per year is estimated using a Bayesian logistic growth model of clonal expansion.
For box and whisker plots in 2b and 2d, the horizontal line indicates the median, the tops and bottoms of the boxes indicate the interquartile range, and top and bottom error bars indicate maxima and minima, respectively.

