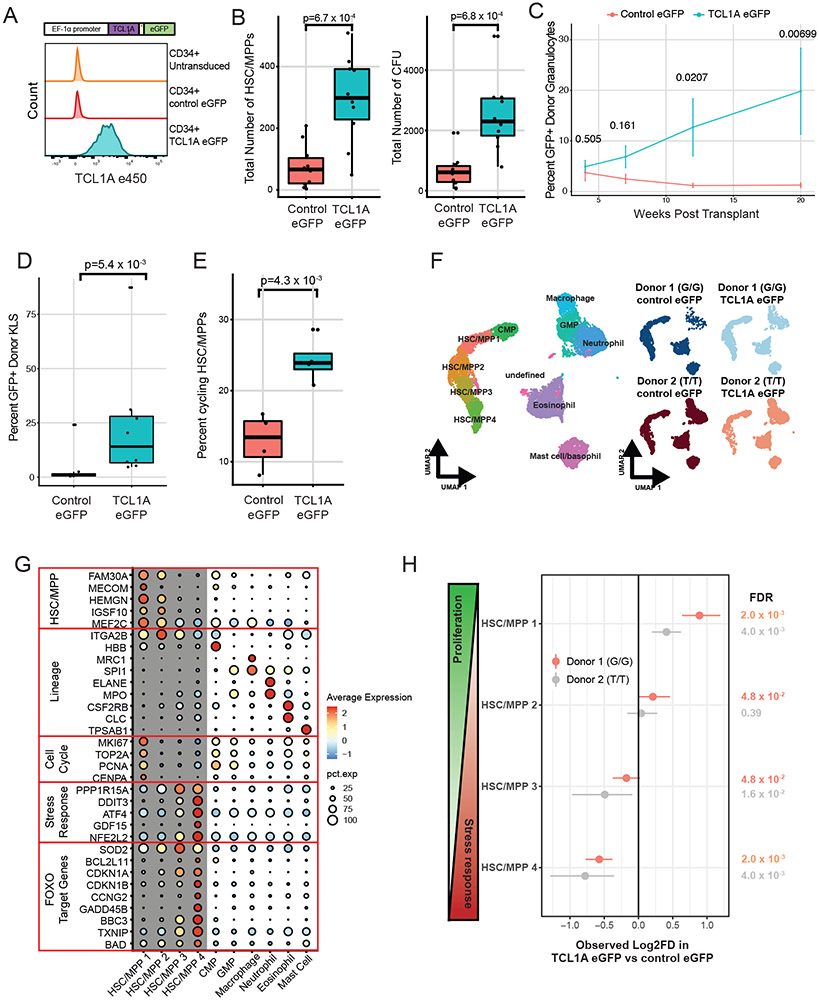
Figure 4∣. TCL1A Expression is Sufficient for HSC Expansion.
A, Schematic of TCL1A-eGFP lentivirus construct (top) and effect of viral transduction on TCL1A expression in human CD34+ HSPCs (bottom). B, Lin−CD34+CD38−CD45RA− cell counts after 14 days liquid culture of transduced HSCs (left), and quantification of colony forming units in methylcellulose after 14 days of liquid culture of transduced HSCs (right); p-values were estimated using a two-sided t-test. n=10 biologically independent replicates for each group. C, Donor granulocyte chimerism of mice transplanted with TCL1A-eGFP or control-eGFP transduced c-Kit+ marrow cells plus GFP− competitor marrow. Shown are mean percent GFP+ donor granulocytes and standard errors for each time point. Hypothesis testing was performed using two-sided Wilcoxon rank sum tests and p-values are indicated above each timepoint. n=8 mice for each group. D, Percent GFP+ donor cells in Lin− c-Kit+ Sca-1+ (KLS) marrow at 22 weeks post-transplant. P-value obtained from a two-sided Wilcoxon rank sum test. n=8 mice for each group. E, Percent Lin−CD34+CD38− cells in cycle by DAPI staining after 10 days liquid culture of transduced HSC/MPPs; p-values were calculated using a two-sided Wilcoxon rank sum test. n=4 biologically independent replicates for each group. F, UMAP of clusters identified after 7 days liquid culture of transduced HSC/MPPs; all samples combined (left) and split by the 4 individual samples (right). G/G or T/T refers to the donor rs2887399 genotype. G, Dot plot illustrating expression of representative marker genes across different cell clusters arranged by functional group. H, Forest plot of log2 fold-difference (Log2FD) in proportion of cells within each HSC/MPP cluster in TCL1A-eGFP versus control-eGFP transduced cells using a permutation test. Each donor represents an independent experiment and the false discovery rate (FDR) for each comparison is shown to the right.
For box and whisker plots in 4b, 4d, and 4e, horizontal lines indicate the median, the tops and bottoms of the boxes indicate the interquartile range, and top and bottom error bars indicate maxima and minima, respectively.

