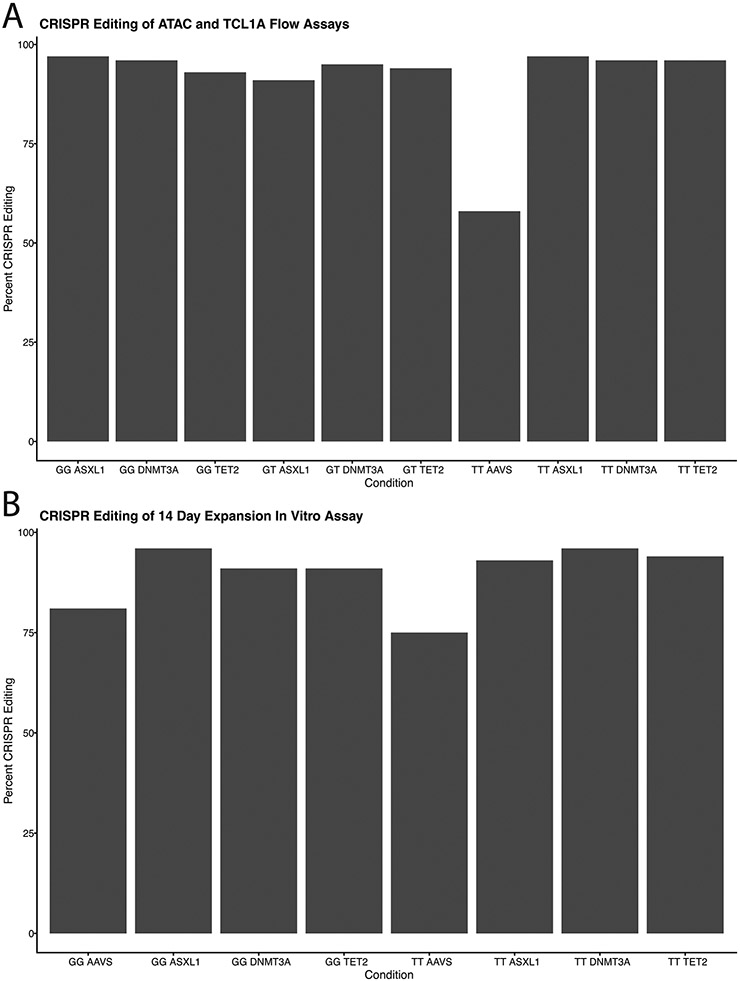
Extended Data Fig 5∣. CRISPR Editing Efficiency.
A. ICE analysis of Sanger traces to determine targeted CRISPR editing efficiency. Bar plots display percent of CD34+ CD38− CD45RA− cells with indel formation in gene of interest. These cells were used for the OMNI-ATAC and intracellular TCL1A flow assays. B. ICE analysis of Sanger traces to determine targeted CRISPR editing efficiency. Bar plots display percent of CD34+ CD38− CD45RA− cells with indel formation in gene of interest. These cells were used for the 14-day expansion assay.

