
Figure 2. Tfcp2l1 regulates AT2 self-renewal and AT1 cell differentiation kinetics during influenza-induced lung regeneration.
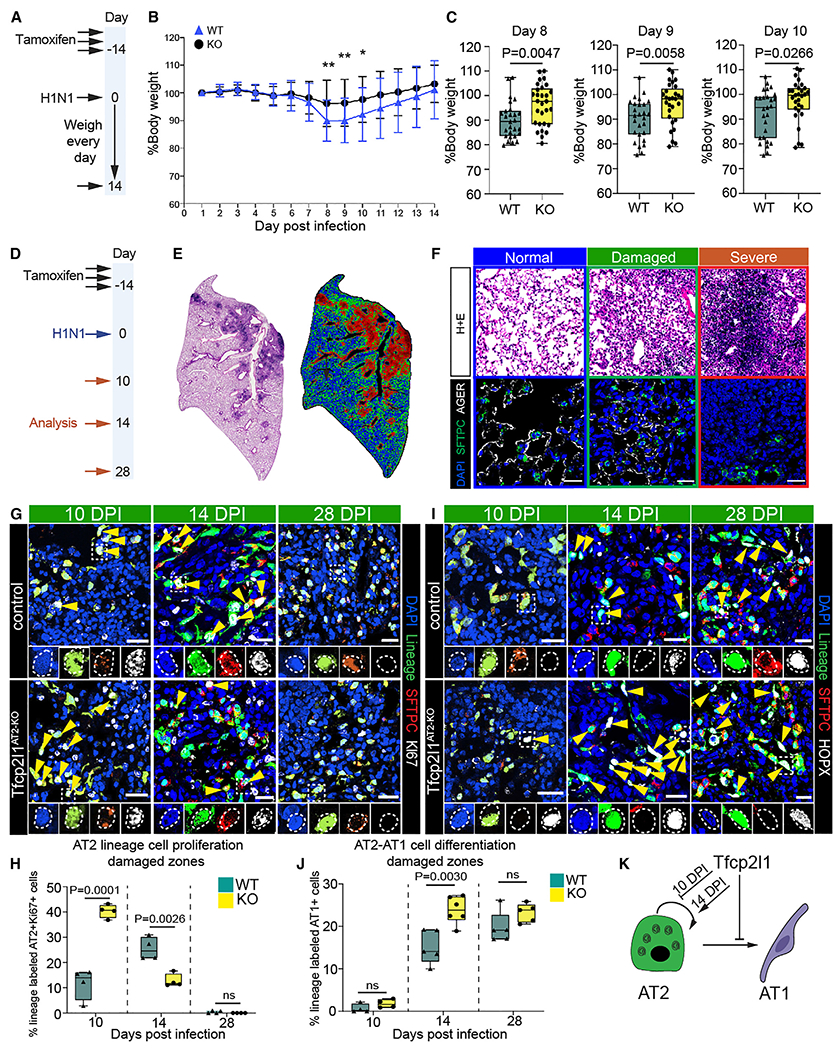
(A) Experimental plan showing tamoxifen treatment and influenza infection and timing to record loss weight.
(B) Percentage of body weight for 14 days post influenza infection.
(C) Body weight quantification from days 8–10. n = 27 control mice and 29 mutant mice.
(D) Experimental schematic showing tamoxifen treatment, influenza infection, and the timing to examine mouse lungs.
(E) Left: H&E stain 14 days post infection (dpi). Right: cluster injury zone map generated from the H&E picture.
(F) Top row: H&E pictures representing the injury zones found at 14 dpi. Colors outlining each box represent different injury zones (blue, normal; green, damaged; red, severe; scale bars, 100 μm). Bottom row: IHC pictures for SFTPC, AGER, and DAPI in the three different injury zones (scale bars, 20 μm).
(G) Immunohistochemistry (IHC) for the AT2 cell lineage markers enhanced yellow fluorescent protein (EYFP), SFTPC, and Ki67 in damaged zones 10, 14, and 28 dpi with highlighted areas to show co-staining of markers (scale bars, 20μm).
(H) Quantification of lineage-traced proliferative AT2 cells in damaged injury zones 10, 14, and 28 dpi.
(I) IHC for the AT2 cell lineage markers EYFP, SFTPC, and HOPX in damaged zones 10, 14, and 28 dpi (with highlighted areas to show co-staining of markers and yellow arrowheads indicating AT1 cell-derived AT2 cells (scale bars, 20 μm).
(J) Quantification of AT1 cell-derived AT2 cells in damaged injury zones 10, 14, and 28 dpi.
(K) Summary diagram showing that Tfcp2l1 represses AT2 self-renewal and AT1 cell differentiation.
All quantification data are represented as mean ± SEM. Two-tailed t test p values are shown; n = 4–5 mice per group.