
Figure 3. Tfcp2l1 regulates AT2 cell-mediated alveolar regeneration in a spatial and temporal manner.
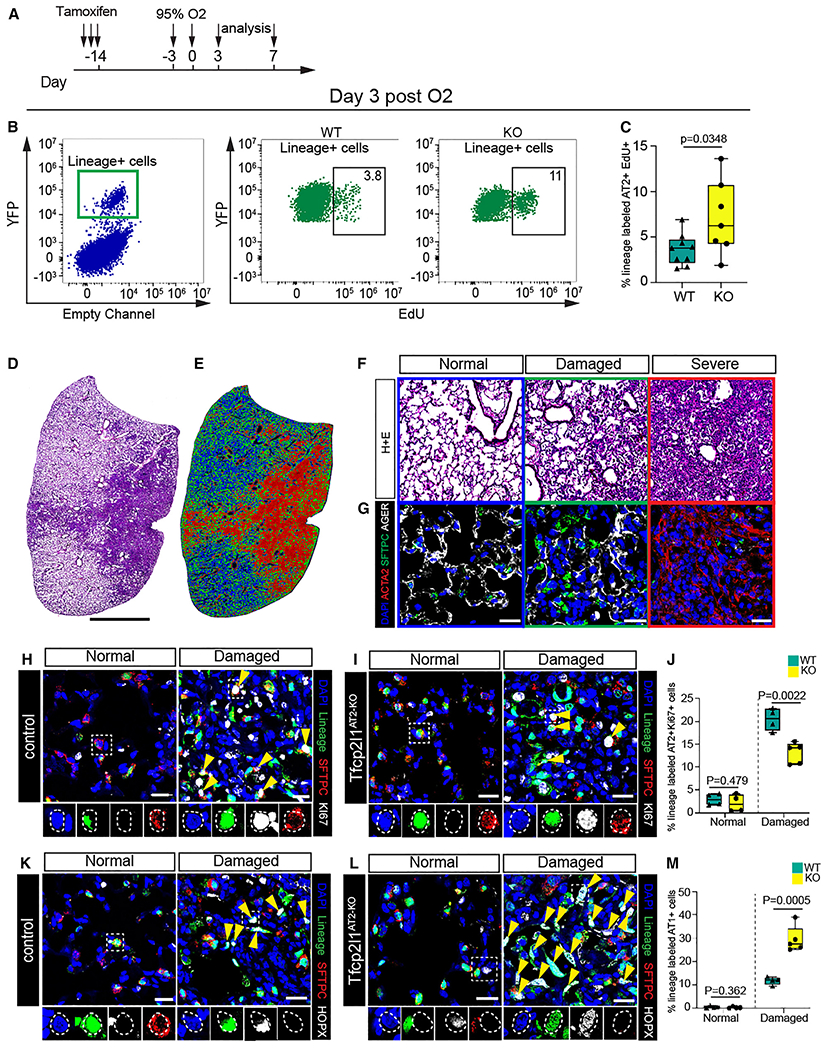
(A) Experimental schematic showing tamoxifen treatment and exposure to hyperoxia with different timing for analysis.
(B) Flow cytometry quantification of EdU and lineage-traced EYFP cells on day 3 post hyperoxia exposure.
(C) Quantification of lineage-traced EYFP and EdU+ cells on day 3 post hyperoxia exposure (n = 7–9 mice per group).
(D and E) Left: H&E stain 7 days post hyperoxia exposure. Right: cluster injury zone map generated from the H&E picture.
(F) H&E pictures; each box panel is a representative picture of the injury zones found 7 days post hyperoxia exposure. Colors in each boxed represent different injury zones (blue, normal; green, damaged; red, severe).
(G) IHC pictures for SFTPC, AGER, and smooth muscle alpha-actin (αSMA) in the three different injury zones (scale bars, 20 μm).
(H and I) IHC for the AT2 cell lineage markers EYFP, SFTPC, and Ki67 in normal and damaged injury zones 7 days post hyperoxia exposure of control and Tfcp2l1AT2-KO mutants, with dashed white boxes and yellow arrowheads highlighting proliferative lineage-traced AT2 cells (scale bars, 20 μm).
(J) Quantification of lineage-traced proliferative AT2 cells in different injury zones 7 days post hyperoxia exposure.
(K and L) IHC for the AT2 cell lineage markers EYFP, SFTPC, and HOPX in normal and damaged zones 7 days post hyperoxia exposure of control and Tfcp2l1AT2-KO mutants, with dashed white boxes and yellow arrowheads highlighting AT1 cells derived from AT2 cells (scale bars, 20 μm).
(M) Quantification of AT1 cell-derived AT2 cells in normal and damaged injury zones 7 days post hyperoxia exposure.
All quantification data are represented as mean ± SEM. Two-tailed t test p values are shown; n = 4–5 mice per group.