
Figure 5. Loss of Tfcp2l1 disrupts stage-specific transcriptional dynamics during AT2 cell regeneration.
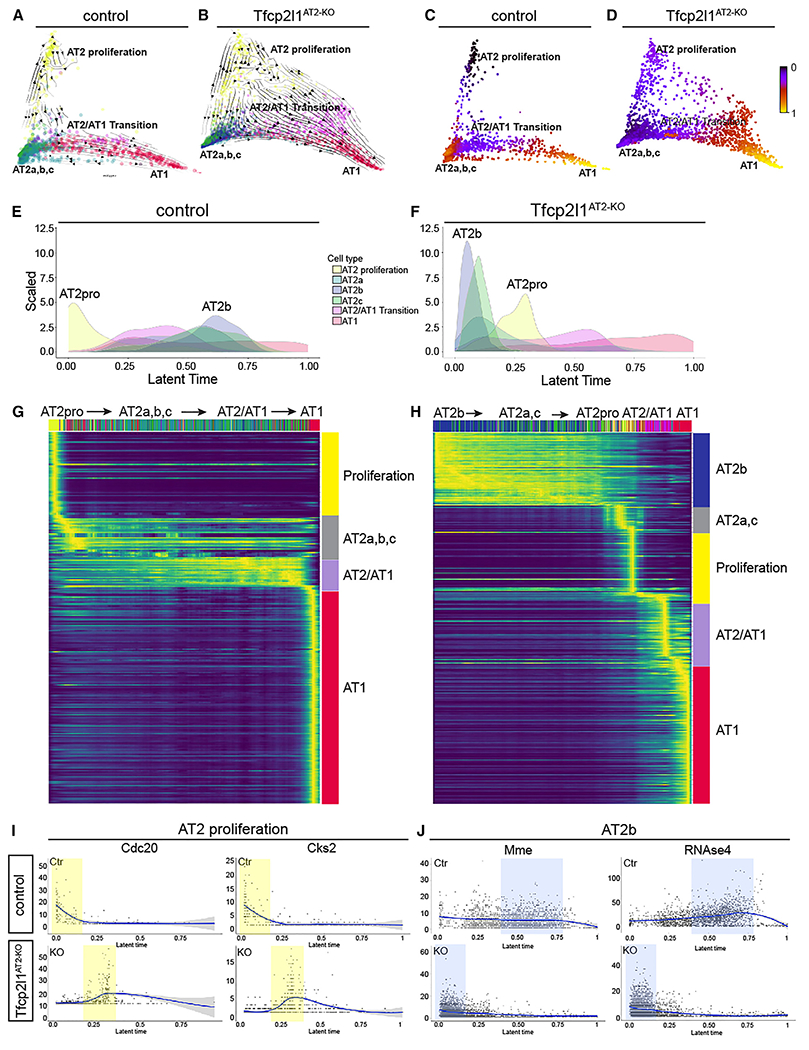
(A and B) scVelo directionality overlaid onto DM reduction of control and Tfcp2l1AT2-KO data 14 dpi.
(C and D) Latent time data inferred from scVelo mapped on the DM as a spectrum of transcriptional changes from a prime or 0 state (blue) to an end state (yellow) in control and Tfcp2l1AT2-KO mutants. Of note, control and Tfcp2l1AT2-KO mutant trajectories end in the AT1 state.
(E and F) Density histograms displaying the distribution of AT2 cell states based on latent time of lineage-traced control and Tfcp2l1AT2-KO AT2 cells. (G and H) Gene expression dynamics resolved along latent time, showing AT2 cell state changes in lineage-traced control and Tfcp2l1AT2-KO AT2 cells.
(I and J) Expression dynamics of example driver genes along latent time (I) Cdc20 and Cks2, control (top), and Tfcp2l1AT2-KO (bottom).
(J) Mme and RNAse4 control (top) and Tfcp2l1AT2-KO (bottom). The proliferation state is shaded in yellow, and the AT2b state is shaded in blue.