
Figure 6. Deep transcriptome analysis of lineage-traced Tfcp2l1-deficient AT2 cells reveals enhanced sensitivity to the post-injury inflammatory milieu.
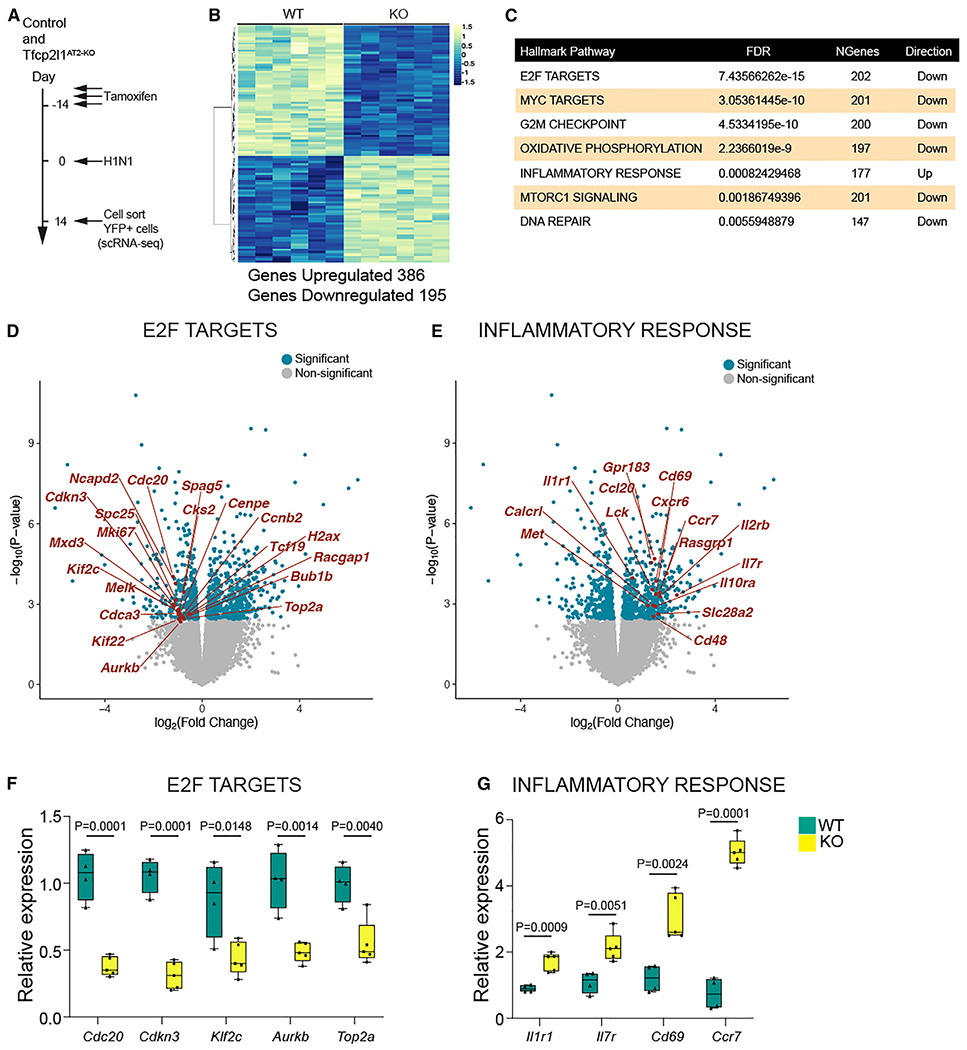
(A) Experimental schematic showing tamoxifen treatment, influenza infection, and the timing to sort lineage-traced EYFP cells to generate bulk RNA-seq libraries from control and Tfcp2l1AT2-KO mice.
(B) Differential expression heatmap comparing control and Tfcp2l1AT2-KO mutants (n = 6).
(C) Hallmark database gene set enrichment analysis of differentially expressed genes between control and Tfcp2l1AT2-KO mice 14 dpi.
(D and E) Volcano plots from RNA-seq data control and Tfcp2l1AT2-KO mice 14 dpi, with dark blue dots indicating statistically significant different genes between control and Tfcp2l1AT2-KO in the E2F and inflammatory response categories (adjusted p < 0.05). An example gene in each category is highlighted in red.
(F and G) qPCR gene expression validation of a subset of differentially expressed genes in the E2F and inflammatory response categories (control, n = 4; Tfcp2l1AT2-KO, n = 5).