
Figure 7. Tfcp2l1 restrains the AT2 cell response to IL-1 signaling.
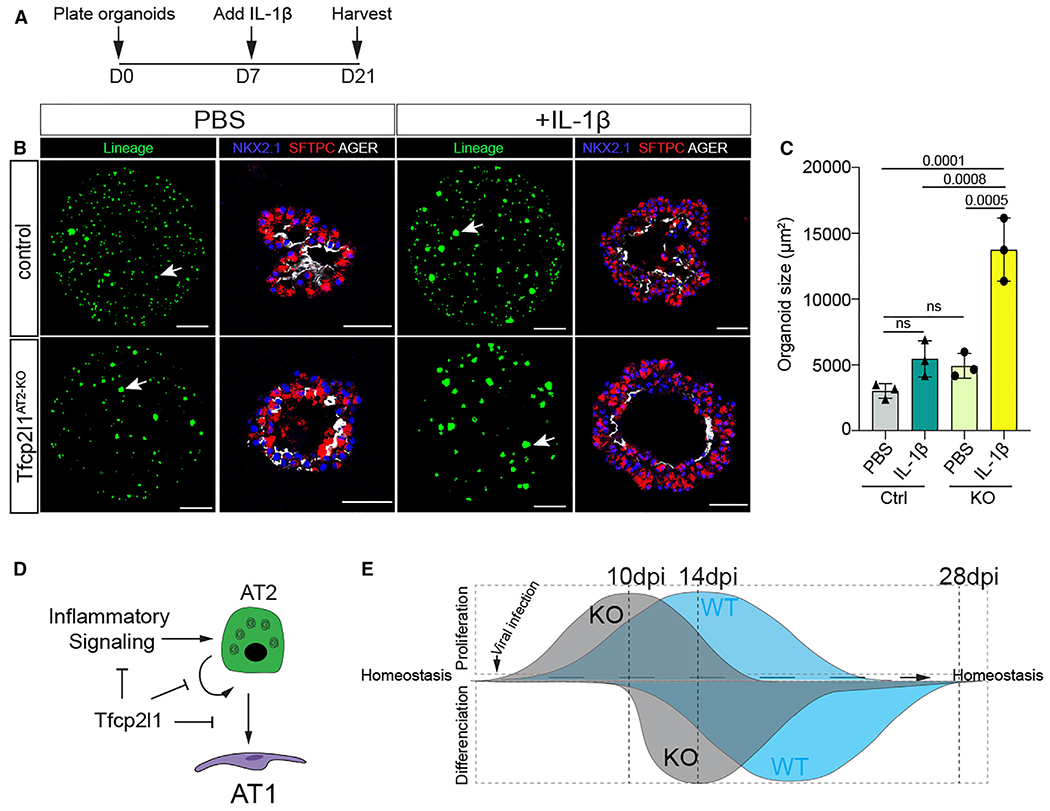
(A) Experimental schematic showing the days for cytokine treatments and duration of organoid culture.
(B) Organoids treated with PBS or IL-1b as noted. Lineage-marked cells are from native EYFP fluorescence, and IHC on sections for SFTPC and AGER expression reveals AT2 and AT1 cells, respectively (lineage panel bar graph, 1,000 μm; IHC bar graph, 50 μm).
(C) Quantification of organoid size after 21 days in culture, comparing PBS and IL-1β in control and Tfcp2l1AT2-KO.
(D) Summary diagram showing that Tfcp2l1 represses AT2 cell proliferation and inflammatory signaling.
(E) Left: Tfcp2l1 is enriched in AT2 cells. The lack of Tfcp2l1 transient increases cell proliferation during lung regeneration. Right: Tfcp2l1 maintains AT2 cell identity and reduces AT2-AT1 cell differentiation.
All data quantification data are represented as mean ± SEM. two-way ANOVA, Tukey test, and not significant; p ≤ 0.05, n = 3 mice per group.