
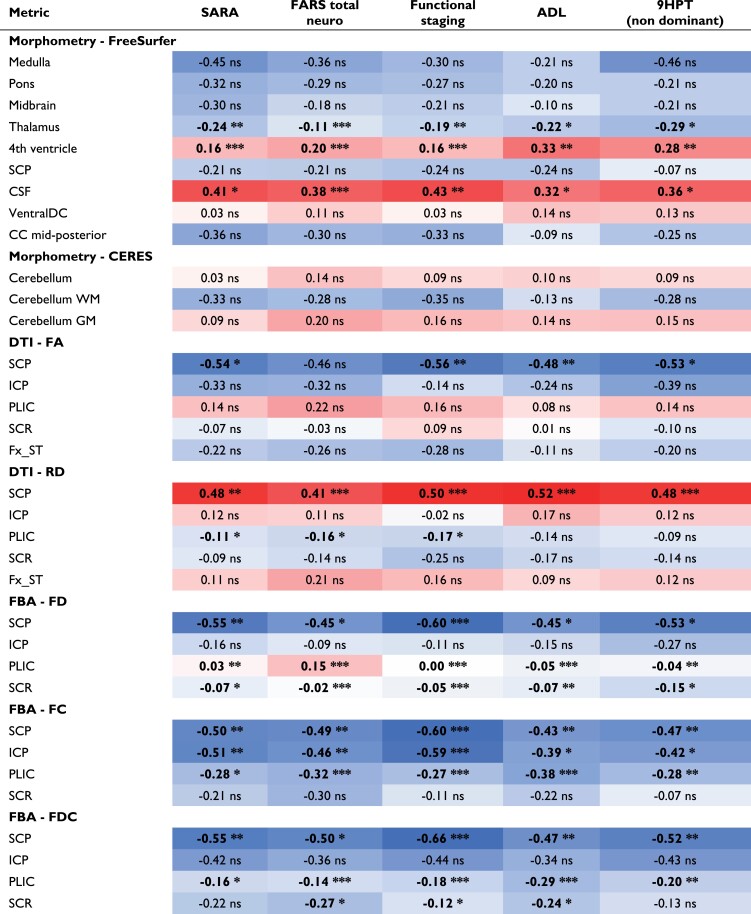
Table 4.
Correlation of imaging metrics with clinical scores
|
Data are the R-values corresponding to Pearson correlation coefficients using all time points; P-values shown correspond to linear models of the same associations that account for the repeated measurements within person. Bold values represent statistical significance. Blue, negative correlation; red, positive correlation.
*P < 0.05.
**P < 0.01.
***P < 0.001.