
Figure 4.
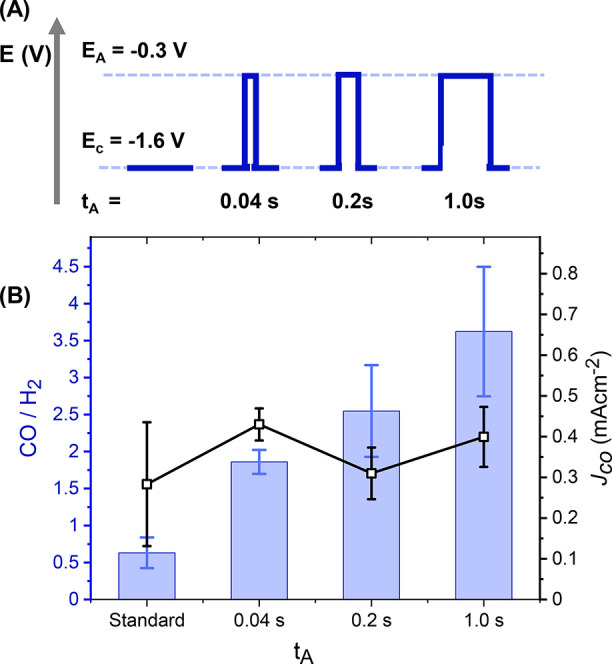
(A) Schematic of different pulse profiles with increasing ta (not to scale). (B) Comparison of CO/H2 and CO partial current densities after 3 h of electrolysis of 0.1 mM [Ni(cyclam)]2+ in 0.5 M NaCl (aq) where EC [tC] = −1.6 VAg/AgCl [5 s]; EA= −0.3 VAg/AgCl with changing tA..