Figure 2.
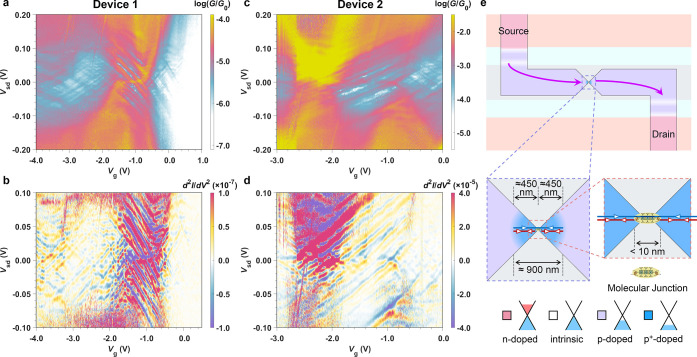
Fabry–Pérot interference. (a,c) Detailed conductance maps of the interference pattern overlapping with molecular charge transitions for Ni-FP8 device 1 and a second device (device 2), respectively. (b,d) Derivative of differential conductance (dId2/dVsd2) measured as a function of bias voltage and gate voltage for both devices. (e) Schematic of the possible interference conditions. Two possible resonance conditions for FP interference within the graphene are indicated by arrows within the highly doped region (blue) and on one of the molecule–graphene interfaces (red). As shown in the schematic, the p/p+ interfaces, generating by Joule heating, may be curved, giving the cavity a confocal or concentric geometry.

