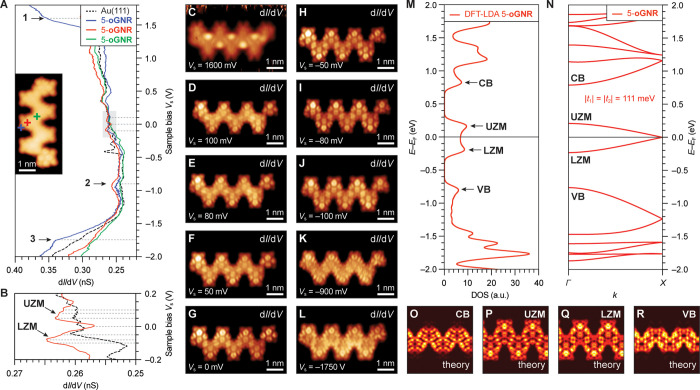
Figure 4.
Electronic structure of 5-oGNRs. (A and B) STS dI/dV spectra recorded on a 5-oGNR at the positions marked in the inset STM topographic image with a red, blue, and green cross (spectroscopy: Vac = 11 mV, f = 455 Hz; imaging: Vs = 50 mV, It = 20 pA, CO-functionalized tip). (C–L) Constant height dI/dV maps recorded at the indicated biases (spectroscopy: Vac = 11 mV, f = 455 Hz). (M) DFT-LDA-calculated DOS of 5-oGNR (spectrum broadened by 10 meV Gaussian). Features associated with the CB, UZM, LZM, and VB are indicted by arrows. (N) DFT-LDA-calculated band structure of a freestanding 5-oGNR. A tight binding fit to the DFT-LDA band structure yields the hopping parameters |t1| = |t2| = 111 meV. (O–R) Calculated DFT-LDA LDOS maps evaluated at the edge of the bulk CB, at the UZM and LZM bands, and at the edge of the bulk VB.

