
Figure 4.
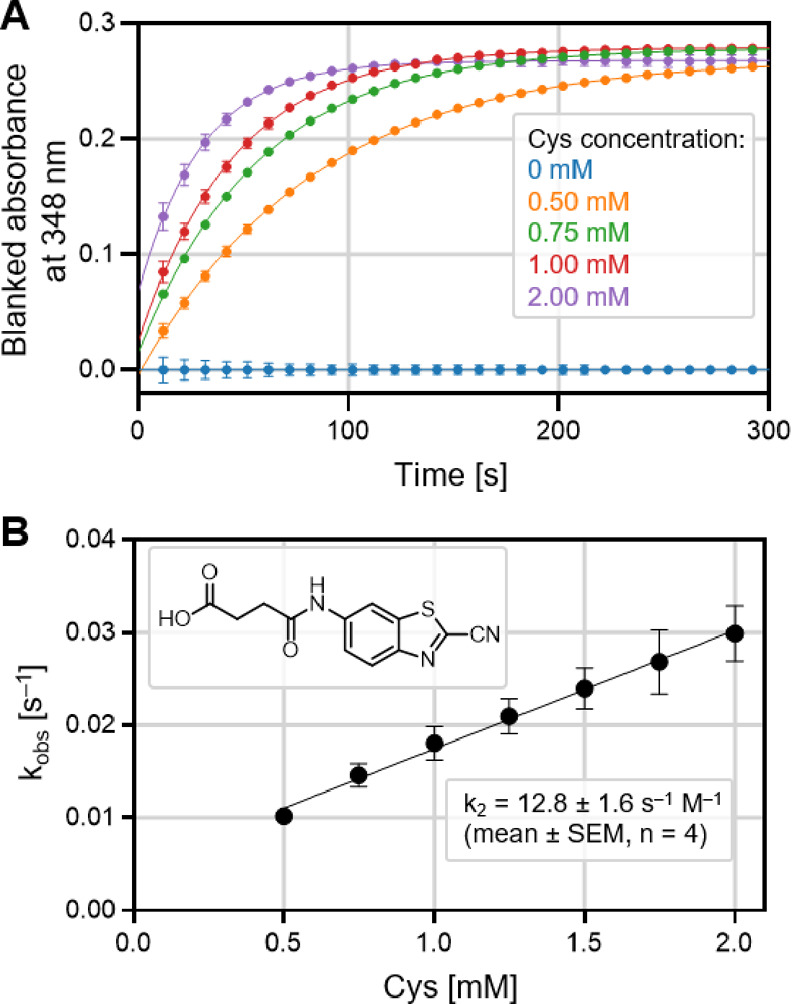
Reaction rate evaluation from multiple Cys concentrations for a reference compound 117.25 (A) Blanked absorbance signals at 348 nm of 117 (50 μM) in the presence of different concentrations of Cys. The solid lines represent the best fit for a single exponential function. (B) Linear relationship plot of kobs vs Cys concentration to give second-order reaction rate constant (k2). The results for 117 are in accordance with the literature data (Table S3).