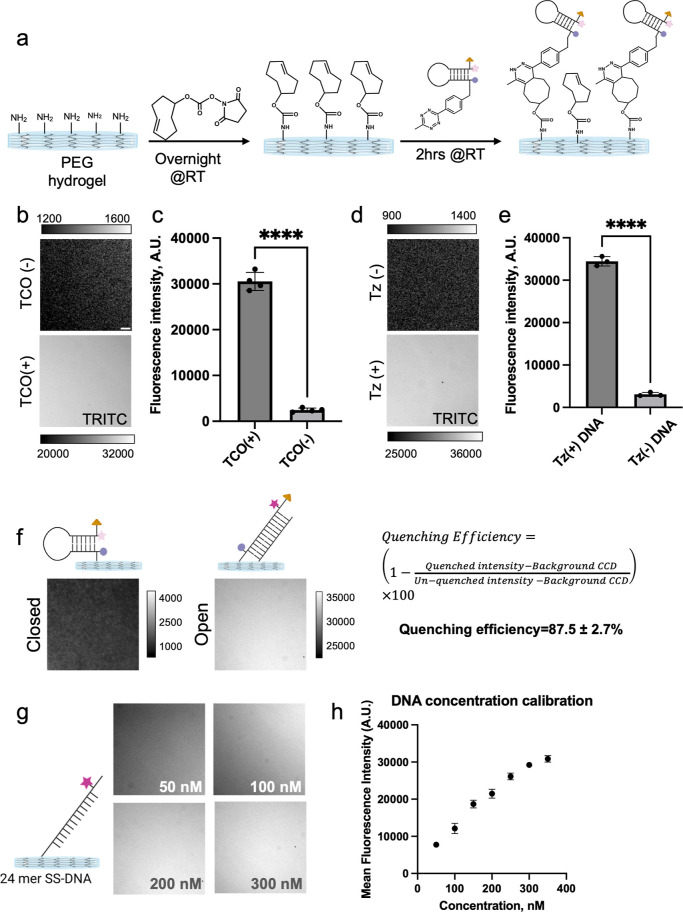
Figure 3.
DNA hairpin surface immobilization using TCO-Tz coupling. (a) Schematic showing TCO modification of hydrogel followed by DNA HP conjugation. (b,c) Representative fluorescence images and quantification of TCO-modified hydrogels and control hydrogels following PS-DNA conjugation. (d,e) Representative fluorescence images and quantification of TCO-modified hydrogels following PS-DNA-Tz conjugation and control PS-DNA conjugation. (f) Representative fluorescence images used to determine HP quenching efficiency. As shown schematically, the fully open HP was obtained by hybridization with complement prior to surface tethering. (g,h) DNA concentration-dependent fluorescence images along with quantification show dose-dependent increase in surface density. ****, ***, **, * and ns indicate p < 0.0001, p < 0.001, p < 0.01, p < 0.05, and not significant, respectively, as determined from one-way ANOVA. Error bars show the standard deviation for N > 3, three different sets of surface preparations. Each intensity value was averaged from at least 10 different regions of interest. Scale bar = 10 μm.

