Figure 5.
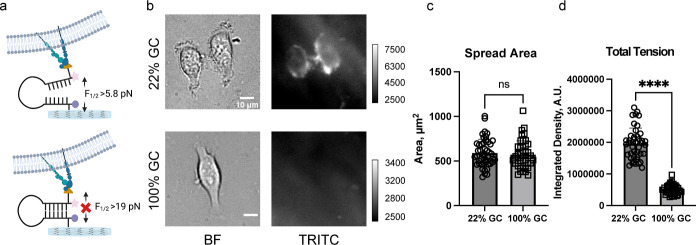
Forces generated by integrins in HeLa cells are 5.8 pN < F1/2 < 19 pN. (a) Schematic representation showing force-mediated unfolding of 22% GC PS DNA HP probes but not the 100% GC probes. (b) Brightfield and fluorescence tension (Cy3B) images of Hela cells on 5.8 and 19 pN 13 kPa hydrogel surfaces. Images were taken after ∼5–6 h of incubation. (c) Bar graph showing single cell spread area on 22 and 100% GC hairpin surfaces. (d) Bar graphs plotting the integrated fluorescence tension signal of single HeLa cells cultured on hydrogel-tethered 22 and 100% GC content PS DNA HP probes. ****, ***, **, *, and ns indicate p < 0.0001, p < 0.001, p < 0.01, p < 0.05, and not significant, respectively, as determined from one-way ANOVA. Error bars show the standard deviation for N > 3, where each experiment was averaged from three or more different cell passages with three different sets of surface preparations. For Each replicate N, at least 15 cells were quantified. Scale bar = 10 μm.

