
Figure 2. Spectral unmixing and visualization for multiplex Raman imaging.
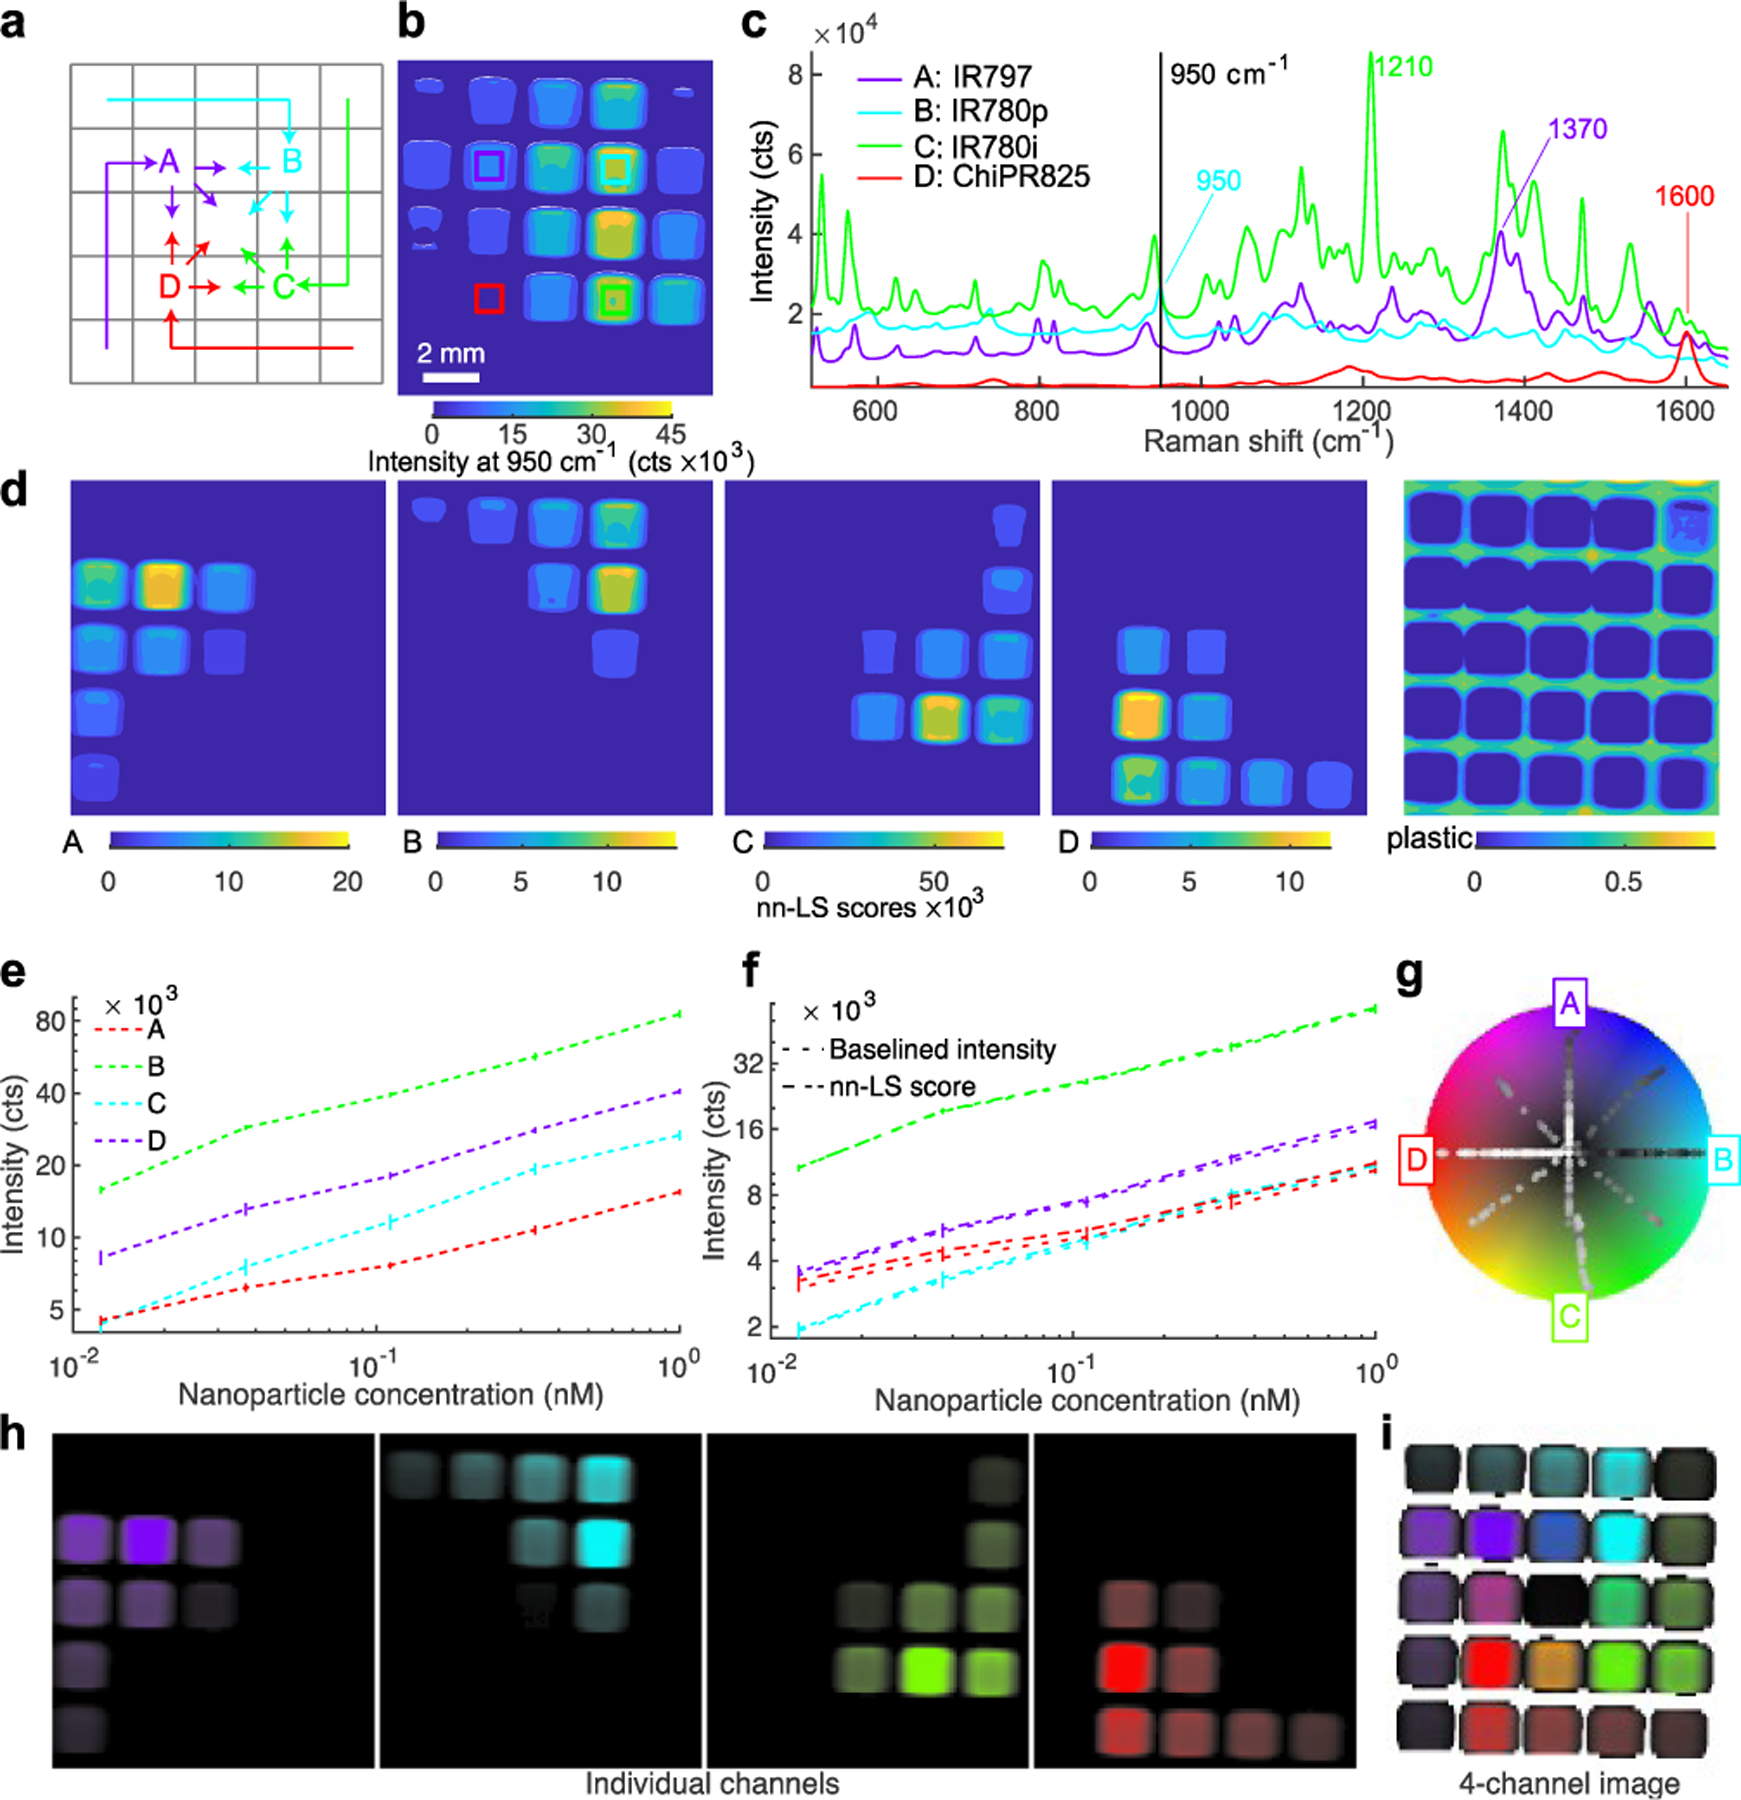
(a) Four SERS nanoparticle configurations featuring distinct reporter molecules were placed in a well plate, at various concentrations and ratios. (b) Raman image showing the intensity at a single wavenumber cannot separate the signals. (c) Reference spectra from pure populations used for spectral unmixing. (d) The nn-LS score obtained for each reference at each pixel unmixes the signals spatially. (e) Raw Raman intensity of representative peaks. (f) The nn-LS score for each configuration (dashed line) matches the corresponding Raman signal intensity after baseline subtraction at the characteristic peak (dotted line). (g) Radial coordinate system where the references are spaced angularly on the circumference of a modified HSV color wheel. The color of each pixel is determined based on its projection onto the color wheel coordinates. Spectra from pure populations are projected on lines from the center (low intensity) towards the direction of their reference (high intensity), whereas mixtures lie in areas between the corresponding references (e.g., blue is a 1:1 mixture of purple A and cyan B). The signal corresponding to “plastic” was excluded from the coordinate system. (h) Single-channel images show the signal quantitation for each nanoparticle configuration. (i) Final image showing the distribution and intensity of the four nanoparticle configurations. In the central well, an equal mixture of all four dyes yields a small vector sum (assigned to black). Pixels with signal (from the included references) below the threshold are rendered transparent. For panels (e-f) the values reported are averages of 648 spectra, with error bars showing the standard deviation from the mean.