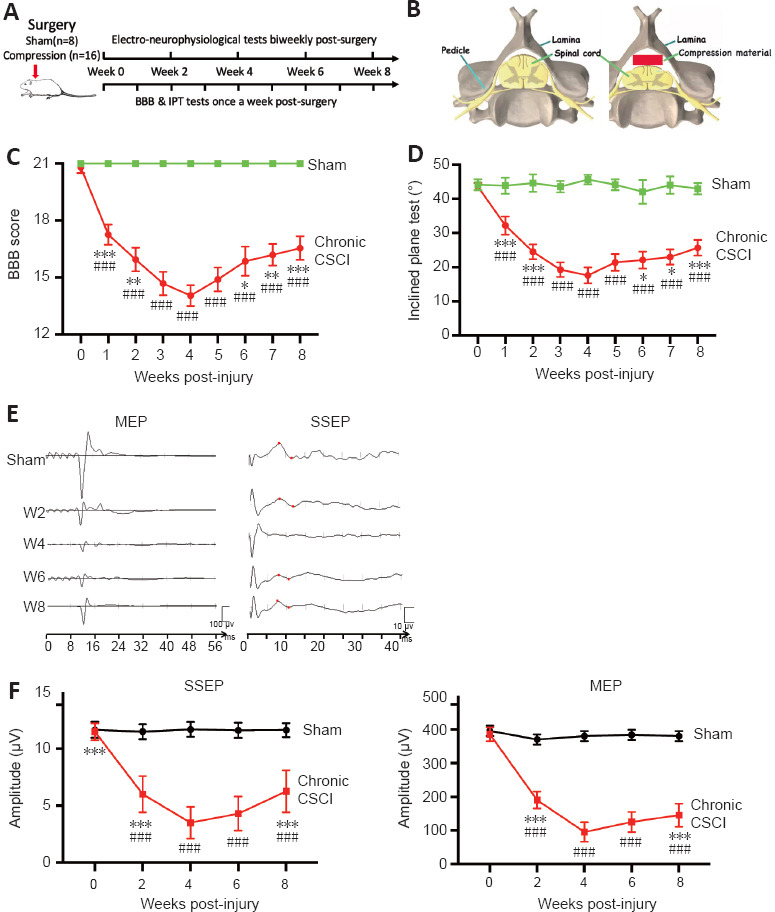
Figure 1.

Neurological functional changes following chronic CSCI.
(A) Study design: 24 adult, female Sprague-Dawley rats (250–280 g) were randomly allocated to sham (n = 8) and chronic CSCI (n = 16) groups. (B) Schematic images of the chronic CSCI model: a polymer was implanted inside the spinal canal to compress the spinal cord. (C, D) BBB scores (C) and IPT angles (D) in the sham and CSCI groups from weeks 1 to 8. (E, F) Representative images (E) and amplitude changes (F) of the MEPs and SSEPs from the sham and chronic CSCI group at different time points (weeks 2, 4, 6, and 8). *P < 0.05, **P < 0.01, ***P < 0.001, vs. week 4; ###P < 0.001, vs. sham group (Student’s t-test). Data are presented as mean ± SD. BBB: Basso, Beattie, and Bresnahan locomotor scale; IPT: inclined plane test; CSCI: chronic compressive spinal cord injury; MEP: motor evoked potentials; SSEP: somatosensory evoked potentials.
