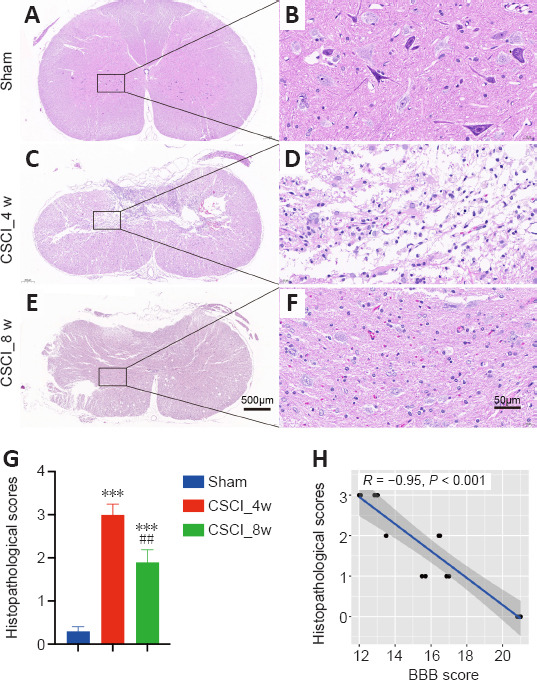
Figure 2.

Histology of spinal cord from the sham and chronic CSCI groups.
(A–F) Representative images of HE staining in the spinal cord of the sham (A, B) and chronic CSCI groups at 4 (C, D) and 8 weeks (E, F). (G) Histopathological scores. (H) Histopathological scores were significantly negatively correlated with BBB scores (Spearman correlation, R = −0.95, P < 0.001). Sample sizes: sham, n = 4; CSCI_4w, n = 4; and CSCI_8w, n = 4. Magnification: A–C, 4×; D–F, 40×. ***P < 0.001, vs. sham group; ##P < 0.01, vs. CSCI_4w group (Student’s t-test). Data are presented as the mean ± standard deviation in G. BBB: Basso, Beattie, and Bresnahan locomotor scale; CSCI: chronic compressive spinal cord injury; HE staining: hematoxylin and eosin staining.
