
Figure 3.
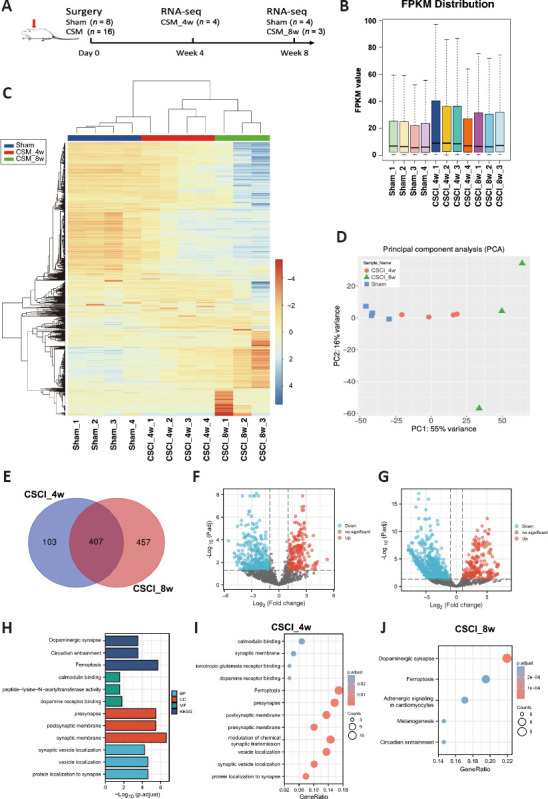
Differential gene expression analysis of sham vs. CSCI_4w and CSCI_8w identified many genes induced upon chronic CSCI.
(A) Study design. (B) Boxplots of the FPKM values of all the samples (sham, n = 4; CSCI_4w, n = 4; CSCI_8w, n = 3). (C) Heatmap of the genes in the sham vs. CSCI_4w vs. CSCI_8w groups. (D) Principal component analysis to demonstrate the source of variance in our data. (E) Venn diagrams show the significantly differentially expressed genes between the sham and CSCI_4w or CSCI_8w groups. (F, G) Volcano plot and heatmap of the comparisons between the sham and CSCI_4w groups. (H) Gene ontology (GO) and Kyoto Encyclopedia of Genes and Genomes (KEGG) analyses of the compression time-dependent genes suggested a vital role of synaptic activity and localization in classifying chronic CSCI rats. (I, J) KEGG pathway analysis of the differentially expressed genes in the CSCI_4w group (I) and CSCI_8w group (J). The bubble color shading indicates the P values (stronger shading indicates a lower P value), and the bubble size indicates the frequency of the KEGG pathways. CSCI: Chronic compressive spinal cord injury.