Figure 5.

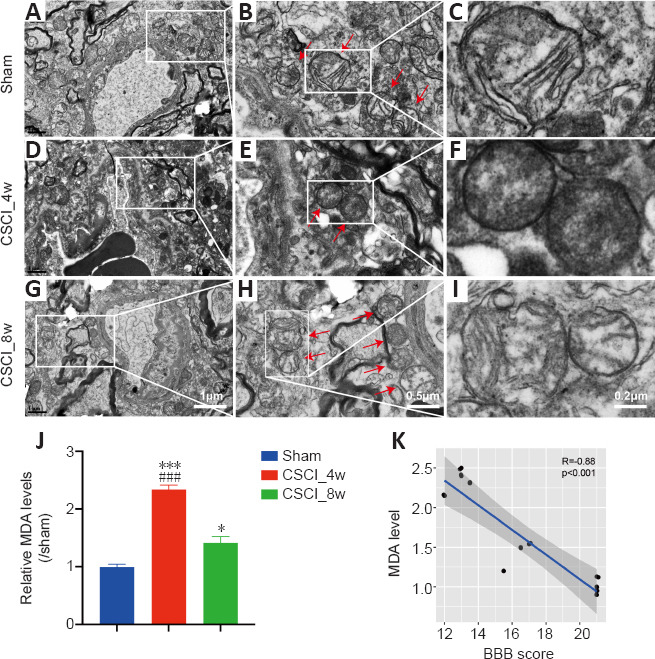
Ferroptosis-specific mitochondrial changes and MDA accumulation levels after chronic CSCI.
(A–I) Representative transmission electron microscopy images of neurons and neuronal mitochondria in the sham (A–C), CSCI_4w (D–F), and CSCI_8w (G–I) groups. Red arrows indicate mitochondria. Ferroptosis-specific changes, including shrunken mitochondria, increased membrane density, and occasionally disrupted outer membranes, were evident in the CSCI_4w group (F). (J) MDA content in the spinal cord was significantly increased at 4 weeks after chronic CSCI, and attenuated at 8 weeks. *P < 0.05, ***P < 0.001, vs. sham group; ###P < 0.001, vs. CSCI_8w group (Student’s t-test). Data are presented as the mean ± standard deviation. (K) MDA level was significantly negatively correlated with BBB scores (Spearman correlation, R = −0.88, P < 0.001). Sample sizes: Sham, n = 4; CSCI_4w, n = 4; and CSCI_8w, n = 4. MDA: Malondialdehyde; CSCI: compressive spinal cord injury.
