
Figure 2.
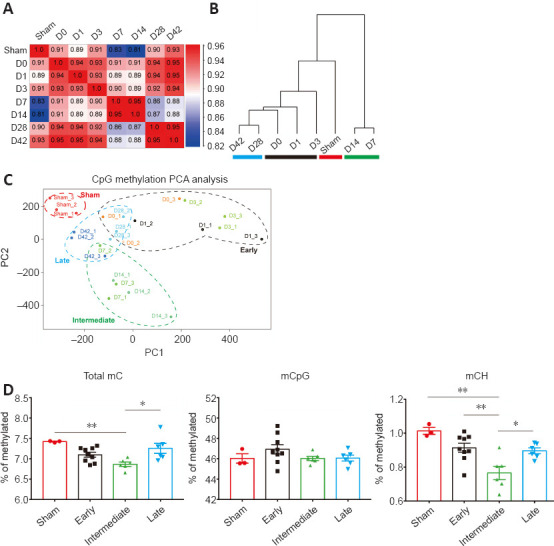
Phases of spinal cord injury are defined by the pattern of CpG methylation.
(A) The similarity matrix of the seven groups and the sham group in CpG methylation. The intermediate stage (days 7 and 14) exhibited a low similarity to other groups. Legend indicating the extent of similarity is shown on the right, and the similarity value number is presented in each block. (B) CpG methylation hierarchical clustering. The similarity matrix and hierarchical clustering were performed with the SeqMonk. Only the CpG methylation context is shown. CHG and CHH methylation was not demonstrated comprehensible clustering result. (C) CpG methylation PCA analysis, which was calculated with the methylkit R package. The red dash circle indicates the sham group; the black, green, and blue circles indicate the early, intermediate and late stage groups, respectively. (D) Methylation value of CpG, CHG, and CHH at various stages after SCI. The methylation levels of total mC and mCH reduced over time (mean ± SD, one-way analysis of variance followed by Bonferroni correction, *P < 0.05, **P < 0.01). mC: Methylated cytosine; PC: principal component.