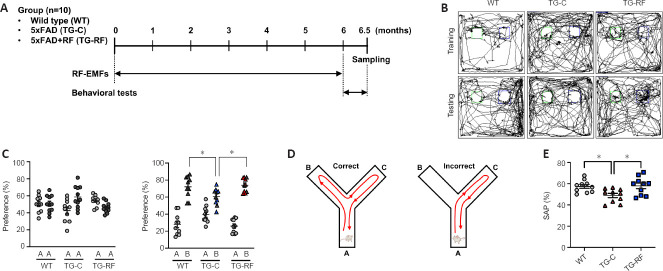
Figure 2.
Effects of radiofrequency electromagnetic field exposure on cognitive function in 5×FAD mice.
(A) Schematic diagram of our experimental procedure. (B) Representative movement trajectory images of mice in the novel object recognition memory test. (C) The percentages of visits during the training (upper) and testing (lower) sessions were evaluated. (D) The representative diagrams for the spontaneous alternation in the Y-maze test. (E) The alternation percentages of each group in the Y-maze test. The data are shown as the mean ± standard error of the mean. *P < 0.05 (n = 10). SAP: Spontaneous alternation performance; TG-C: sham-exposed TG; TG-RF: radiofrequency electromagnetic fields-exposed TG; WT: wild-type.

