
Figure 7.
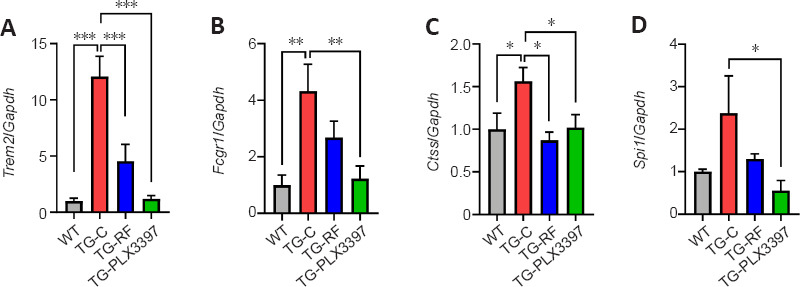
Changes in the mRNA expression levels of genes related to microglial function in the hippocampus following radiofrequency electromagnetic fields exposure.
The bar graphs show the levels of mRNAs encoding Trem2 (A), Fcgr1 (B), Ctss (C), and Spi1 (D) in the hippocampi of 5×FAD mice. The values are shown as the mean ± standard error of the mean. *P < 0.05, **P < 0.01, ***P < 0.001 (n = 6). TG-C: Sham-exposed TG; TG-RF: radiofrequency electromagnetic fields-exposed TG; TG-PLX3397: PLX3397-treated TG; WT: wild-type.