Figure 3.
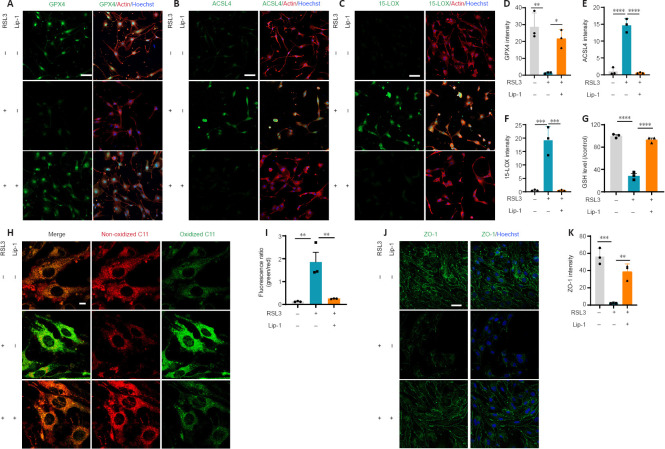
Liproxstatin-1 inhibits bEnd.3 cell ferroptosis and increases tight junction protein expression.
(A–C) Representative immunofluorescence images of glutathione peroxidase 4 (GPX4) (green) (A), Acyl-CoA synthetase long-chain family member 4 (ACSL4; green) (B), 15-lipoxygenase (15-LOX; green) (C), actin (red) and Hoechst (blue) in bEnd.3 cells. Scale bars: 50 µm. (D–F) Quantification of GPX4 (D), ACSL4 (E) and 15-LOX (F) fluorescence intensity in each group (n = 3). (G) The concentration of GSH in each group (n = 3). (H) Representative fluorescence images of BODIPY 581/591 C11 staining. Scale bars: 10 µm. (I) Quantitative analysis of the fluorescence ratio of green (oxidized C11)/red (non-oxidized C11) (n = 3). (J) Representative immunofluorescence images of zonula occludens-1 (ZO-1; green) and Hoechst (blue). Scale bars: 50 µm. (K) Quantification of ZO-1 fluorescence intensity in each group (n = 3). *P < 0.05, **P < 0.01, ***P < 0.001, ****P < 0.0001. Data were analyzed by one-way analysis of variance followed by Tukey’s post hoc test. Lip-1: Liproxstatin-1.

