Figure 5.

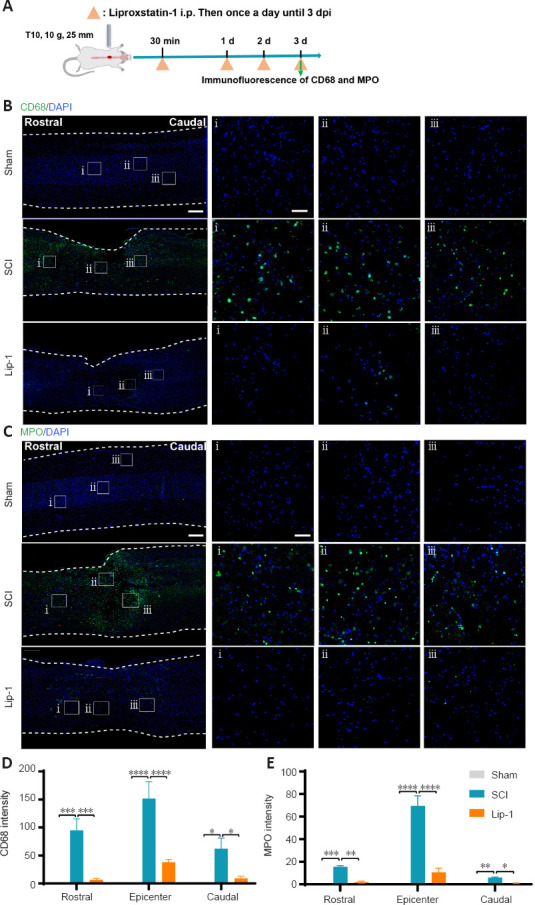
Liproxstatin-1 inhibits the infiltration of macrophages and neutrophils after SCI.
(A) Timeline of the experiments. (B) Representative confocal immunofluorescence images of CD68 (green) staining and DAPI (blue) in the sagittal view of the spinal cord. Scale bars: 500 µm and 50 µm (i, ii, iii). i, ii, and iii are the magnified images of the region of interest in the leftmost panorama. (C) Representative confocal immunofluorescence images of MPO (green) staining and 4′,6-diamidino-2-phenylindole (DAPI; blue) in the sagittal view of the spinal cord. Scale bars: 500 µm and 50 µm (i, ii, iii). i, ii, and iii are the enlarged images of the region of interest in the leftmost panorama. (D–E) Quantification of CD68+ intensity (D) and MPO+ intensity (E) at the epicenter and rostral and caudal regions (both 3 mm from the epicenter) of the spinal cord tissue (n = 3). *P < 0.05, **P < 0.01, ***P < 0.001, ****P < 0.0001. Data were analyzed by one-way analysis of variance followed by Tukey’s post hoc test. Lip-1: Liproxstatin-1; MPO: myeloperoxidase; SCI: spinal cord injury.
