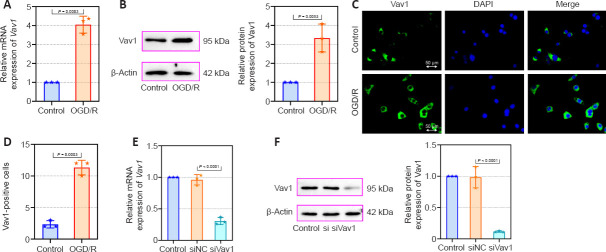
Figure 6.
Increased Vav1 expression in BV-2 cells subjected to OGD/R.
(A) Vav1 mRNA expression in control BV-2 cells and BV-2 cells subjected to OGD/R. (B) Vav1 protein expression in control BV-2 cells and BV-2 cells subjected to OGD/R. (C) Immunofluorescence staining for Vav1 in control BV-2 cells and BV-2 cells subjected to OGD/R. Compared with the control cells, Vav1 expression was increased in OGD/R cells. Nuclei were stained with DAPI (blue). Scale bars: 50 μm. (D) Quantification of Vav1-positive cells. (E) Vav1 mRNA expression in Vav1 knockdown BV-2 cells. (F) Vav1 protein expression in Vav1 knockdown BV-2 cells. Data are expressed as the mean ± SD, and were analyzed by unpaired t-test (A, B, D) or one-way analysis of variance followed by Tukey’s multiple comparisons test (E, F). The experiments were repeated three times. DAPI: 4′,6-Diamidino-2-phenylindole; OGD/R: oxygen-glucose deprivation/reoxygenation; Vav1: Vav guanine nucleotide exchange factor 1.

