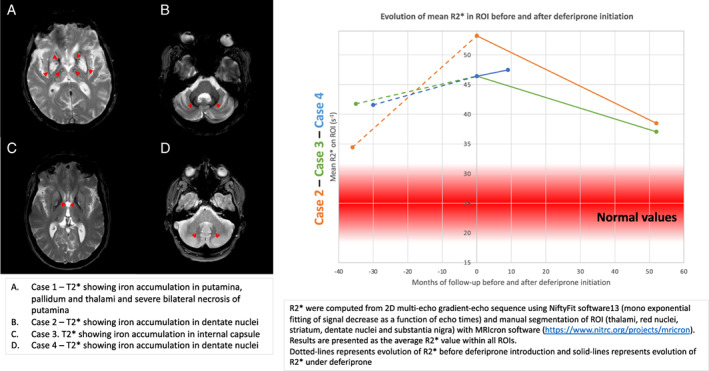
FIG 1.

MRI pattern and evolution of mean R2* on thalami, red nuclei, striatum, dentate nuclei, and substantia nigra in cases 2, 3, and 4. (A) Case 1, T2* showing iron accumulation in putamina, pallidum, and thalami and severe bilateral necrosis of putamina. (B) Case 2, T2* showing iron accumulation in dentate nuclei. (C) Case 3, T2* showing iron accumulation in internal capsule. (D) Case 4, T2* showing iron accumulation in dentate nuclei. Estimation of brain iron overload in ROI using R2*. R2* were computed from 2D multi‐echo gradient‐echo sequence using NiftyFit software 12 (mono exponential fitting of signal decrease as a function of echo times) and manual segmentation of ROI (thalami, red nuclei, striatum, dentate nuclei, and substantia nigra) with MRIcron software (https://www.nitrc.org/projects/mricron). Results are presented as the average R2* value within all ROIs. Dotted lines represents evolution of R2* before deferiprone introduction and solid‐lines represents evolution of R2* under deferiprone. [Color figure can be viewed at wileyonlinelibrary.com]
