
FIGURE 3.
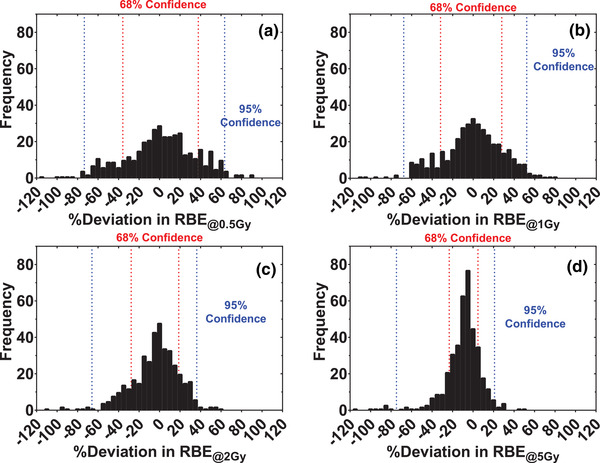
Frequency distribution of the percent deviations between the measured relative biological effectiveness (RBE) values and those predicted by our model trained on the data excluding the predicted point for RBE defined at the (a) 0.5 Gy, (b) 1 Gy, (c) 2 Gy, and (d) 5 Gy dose levels. The red and blue lines show asymmetric 68% and 95% confidence intervals determined by bootstrapping