
Figure 10: Defining analysis parameters for spike extraction.
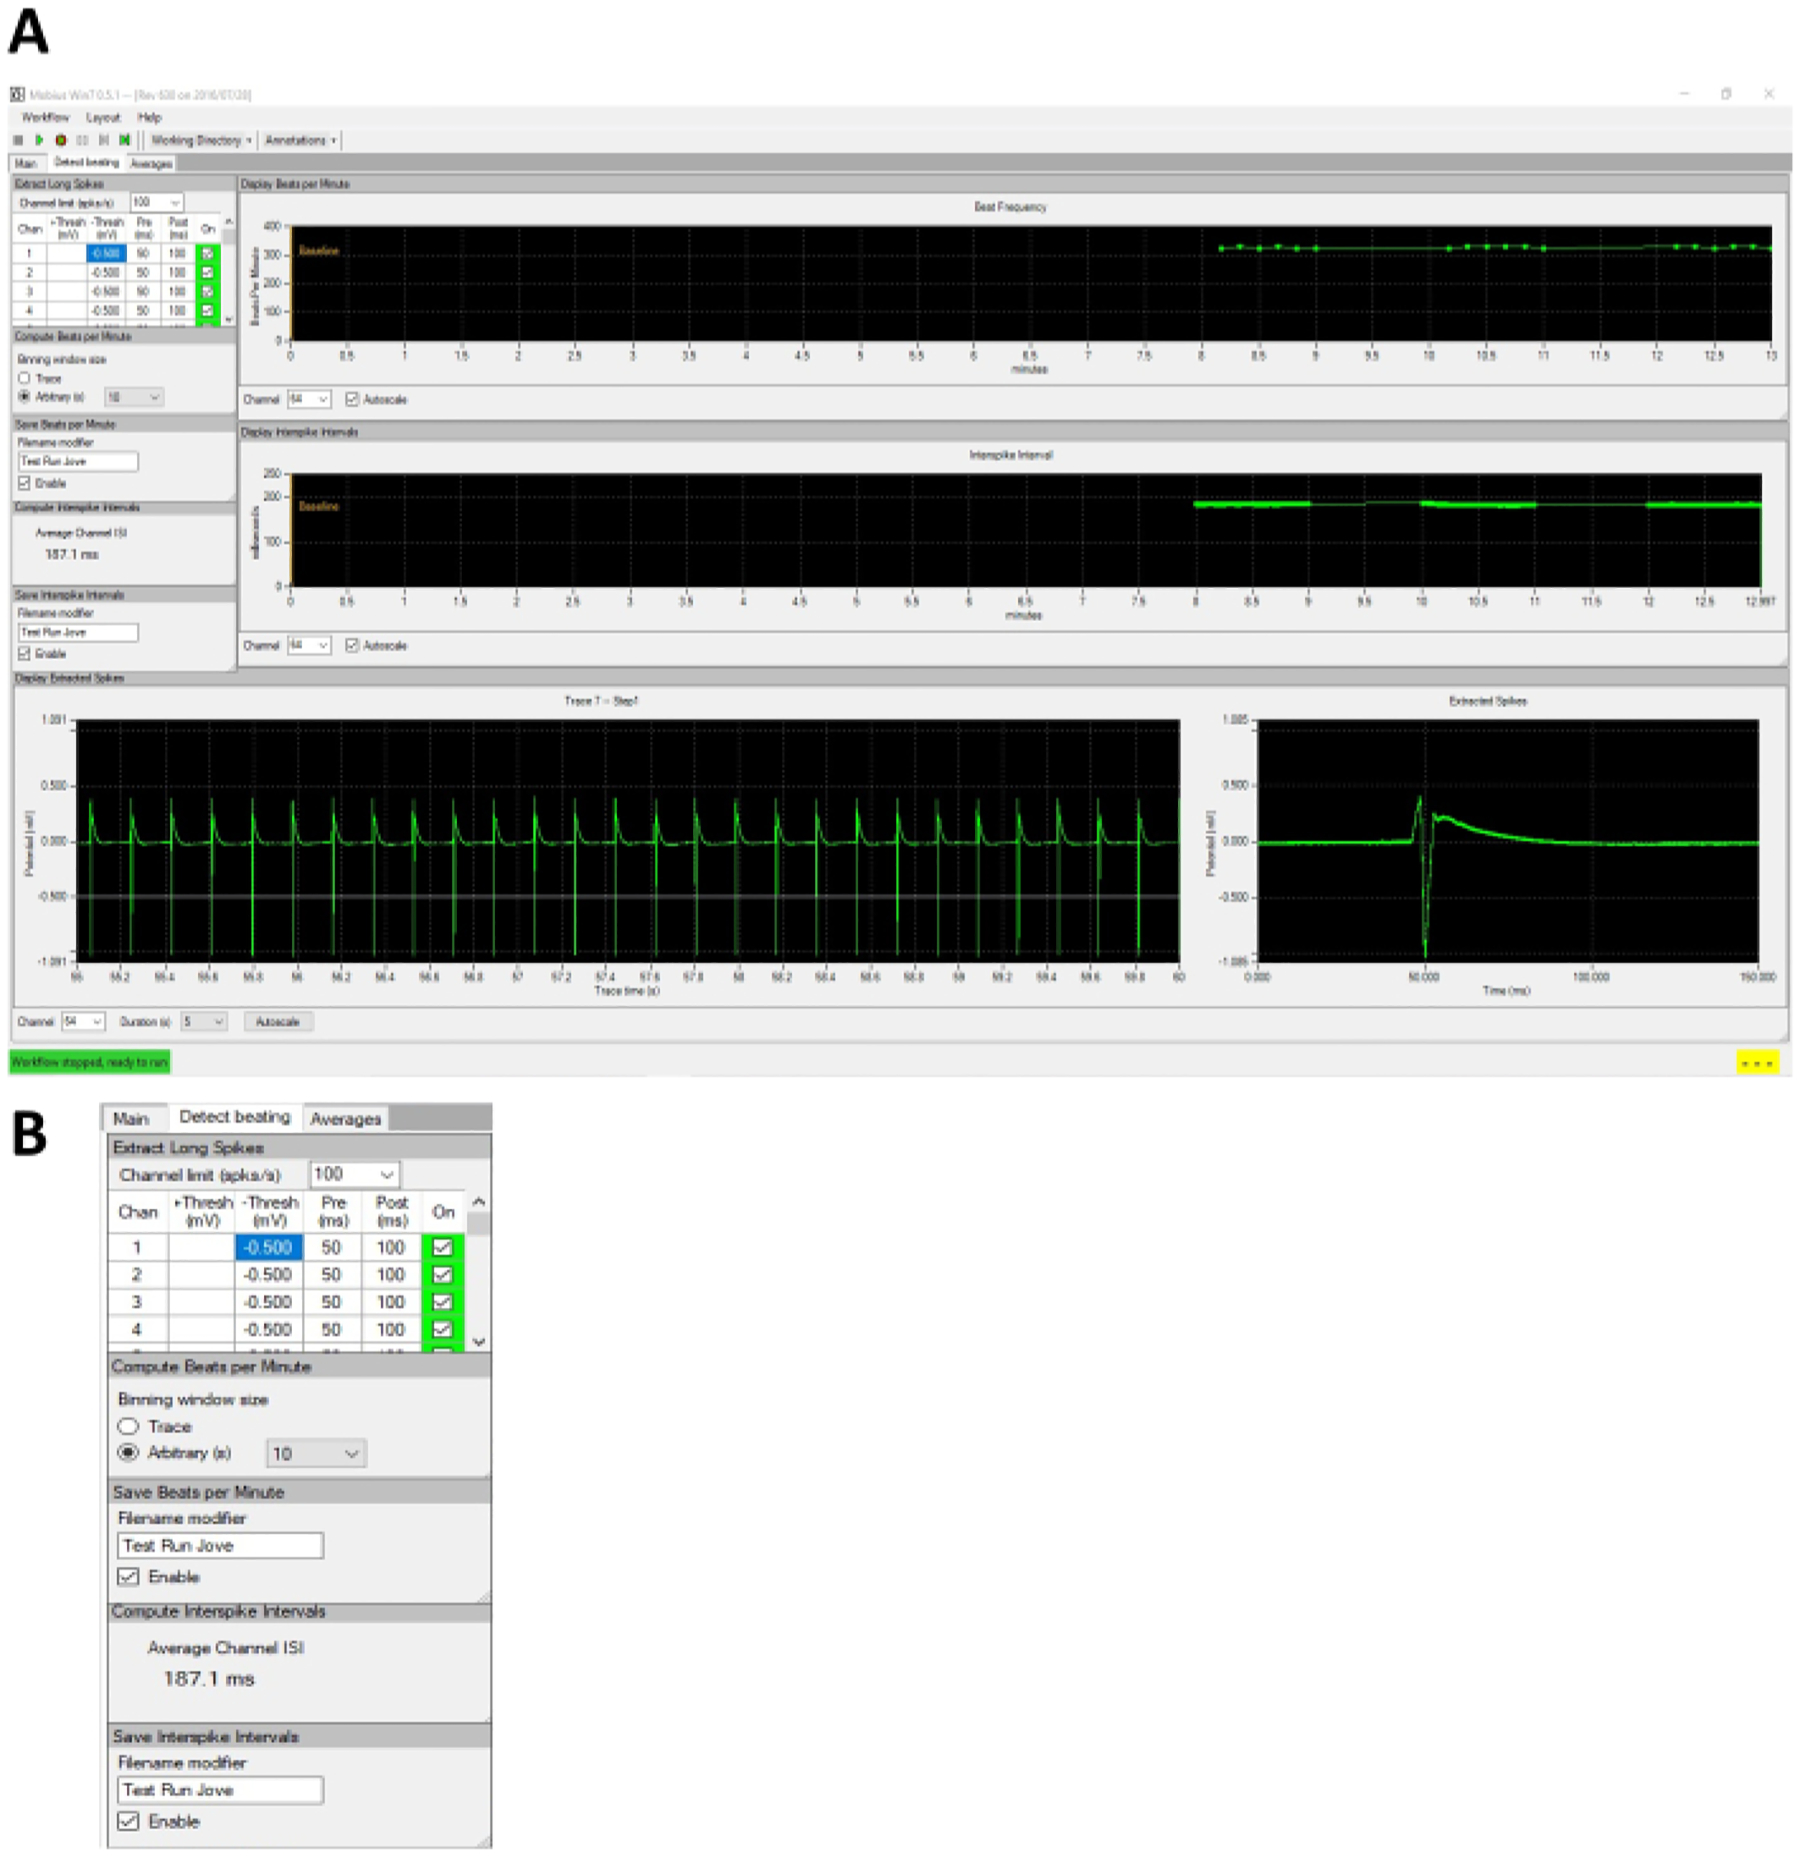
(A) Representative analysis template results for 3 selected traces of a single channel. The top panel displays beat frequency for the three selected traces (three defined groupings of data points), and each point represents a 10-s average for beat frequency during the specific trace. The middle panel displays inter-spike interval for the three selected traces (three defined groupings of data points), and each data point represents the inter-spike interval between two consecutive spikes. The lower left panel shows selected representative extracted spikes for the last 5 s of the third trace, whereas the lower right panel shows an extracted waveform derived from the 5-s group of extracted spikes in the lower left panel. (B) Expanded view of the analysis window showing parameters used in the analysis of beating frequency for the 3 traces.