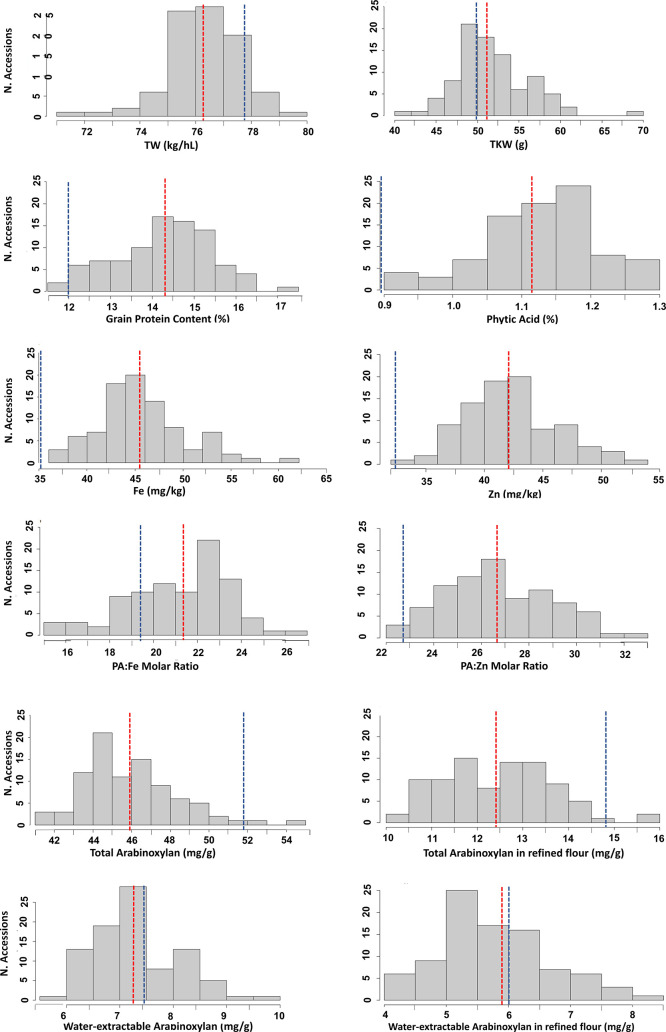
Figure 1.
Number of spelt genotypes found in each range of variation for the different quality traits evaluated across the two cropping cycles of the study. Red and blue dots lines indicate the mean value of spelt genotypes and modern common wheat cultivars groups, respectively (averaging genotypes and years).

