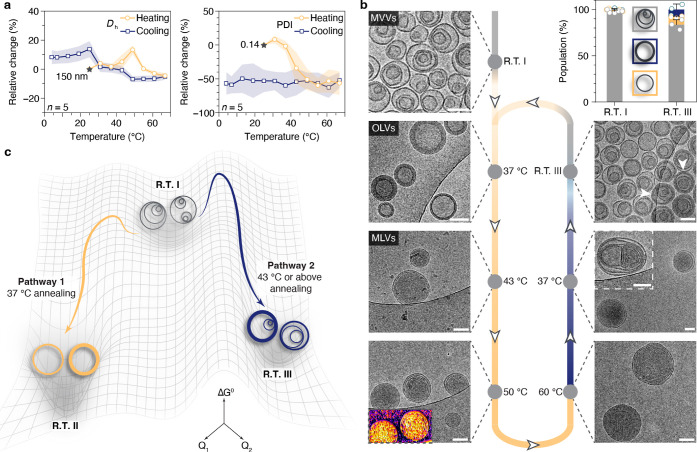
Figure 4.
Energy landscapes and pathway selection of assemblies navigated by temperatures. (a) Relative change of Dh (%) and PDI (%) of assemblies as monitored by the temperature trend measurements in DLS. Characterization was performed on five different batches of samples (n = 5). (b) Cryo-TEM images of self-assemblies as vitrified at the indicated temperatures during the first heating/cooling cycle. Scale bars are 100 nm. Vesicles with two stacked bilayers are highlighted by arrows in R.T. III. (c) Schematic illustration of the pathway selection of assemblies at R.T. as modulated by the annealing temperature.

