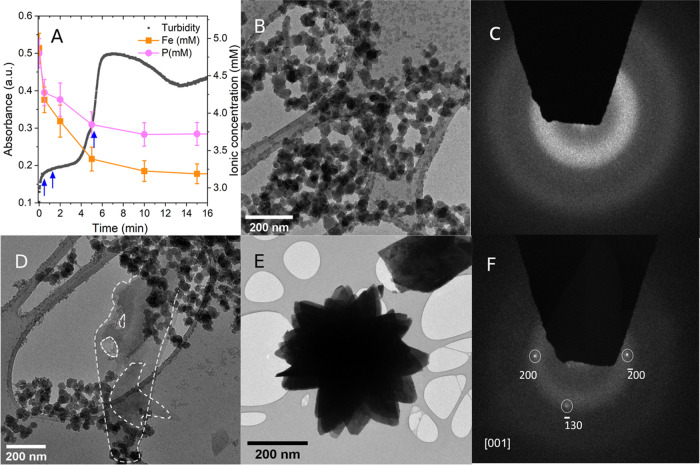
Figure 2.
(A) In situ, time-resolved turbidity (black curve) and ex situ ICP-OES analyses of dissolved species (Fe, orange; P, pink points) during a vivianite precipitation experiment at SI 10.19, with error bars representing values from three repeat measurements. Arrows in blue represent sampling points for TEM analysis; (B) TEM micrograph of solids after 30 s of reaction, showing aggregated nanoparticles; (C) associated SAED pattern of panel B showing diffused scattering features indicating an amorphous phase; (D) TEM micrograph after 100 s of reaction showing both the amorphous nanoparticulate aggregates and the initial thin vivianite platelets (dashed white outline); (E) TEM micrograph of solids after 6 min showing radial platy florets of vivianite; and (F) associated SAED pattern of panel E indexed along the [001] zone axis.

