
Figure 4.
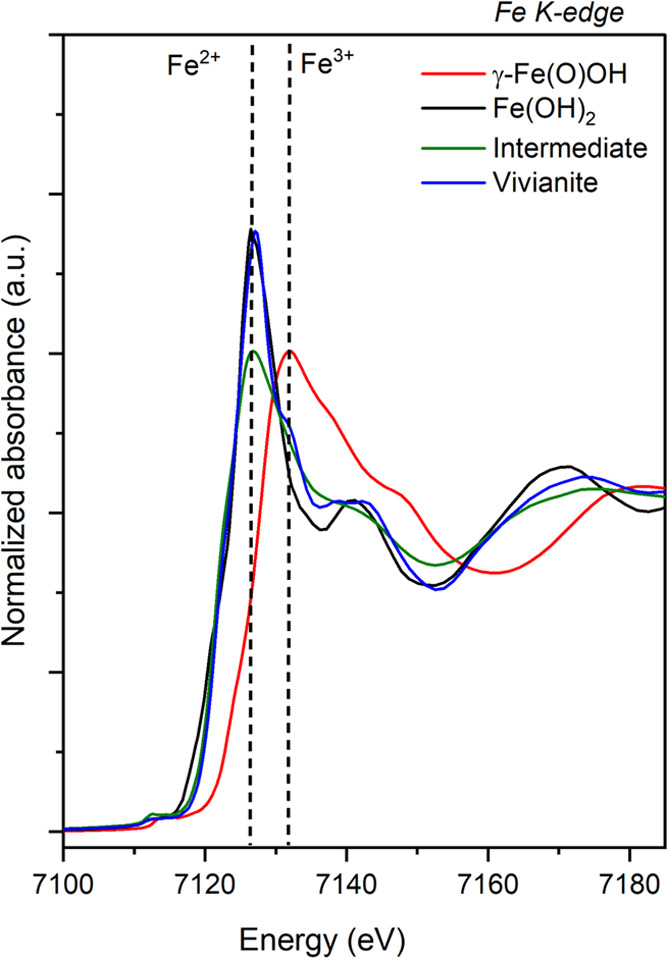
Normalized Fe K-edge XANES spectra collected for synthetic γ-Fe(O)OH (reference for Fe3+), Fe(OH)2 (reference for Fe2+), amorphous intermediate, and vivianite. Dashed lines represent energy edge positions for Fe2+ and Fe3+ oxidation states.