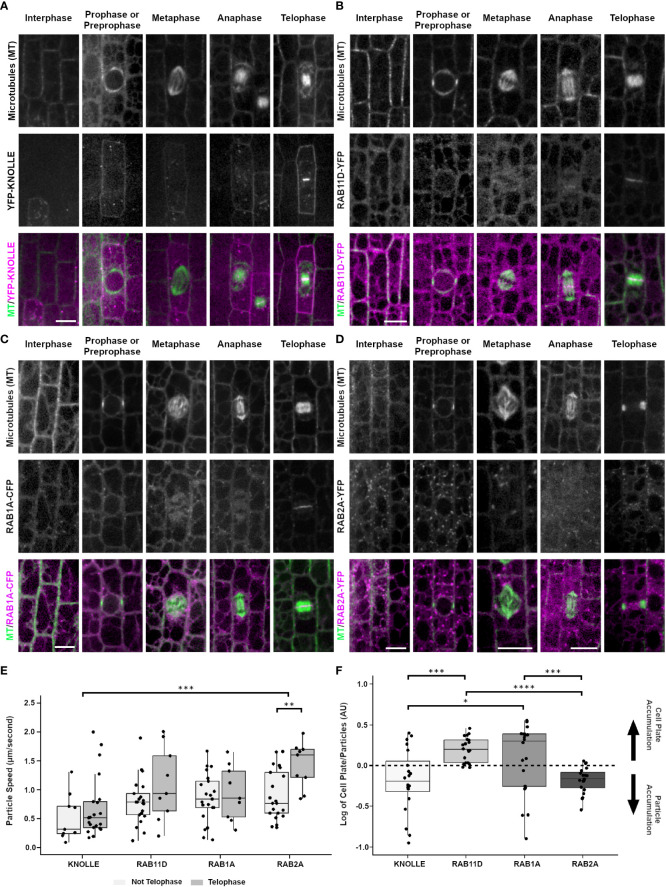
Figure 4.
Localization of cell plate specific syntaxin KNOLLE (YFP-KNOLLE), likely trans-golgi marker RAB11D (RAB11D-YFP), vesicle tethering protein RAB1A (RAB1A-CFP), and golgi marker RAB2A (RAB2A-YFP) from the abaxial side of maize leaves in regions with symmetrically dividing cells. Microtubules (top row), marker (middle) and merged (bottom, microtubules in green and marker in magenta). Microtubules were imaged with CFP-TUBULIN in (A, B, D). Microtubules were imaged with YFP-TUBULIN in (C). (A) YFP-KNOLLE accumulates in motile particles, the plasma membrane and cell plate in mitotic cells. (B) RAB11D-YFP localizes as motile particles at all stages and accumulates in the cell plate. (C) RAB1A-CFP accumulates in motile particles and in the cell plate at telophase. (D) RAB2A-YFP accumulates in motile particles throughout interphase and mitosis. During telophase, RAB2A-YFP weakly accumulates in the cell plate. Scale bars for panels (A-D) are 10µm; if unlabeled, the micrograph has the same scale as the interphase cell. (E) Particle speeds of YFP-KNOLLE, RAB11D-YFP, RAB1A-CFP, and RAB2A-YFP in telophase vs. non-telophase cells. A t-test with Bonferroni Correction of the various marker comparisons shows that there are no significant differences in particle speeds in interphase cells. For dividing cells, there are no significant differences in particle speeds besides KNOLLE and RAB2A, ***p < 0.001, and RAB2A telophase and non-telophase cells **p < 0.01. (F) Relative fluorescence accumulation of YFP-KNOLLE, RAB11D-YFP, RAB1A-CFP and RAB2A was measured in cell plates versus in particles. 20 cell plates and 100 particles were measured for each marker from at least four plants. After determining that datasets were normally distributed (Jarque-Bera test) one-way Anova tests with the Bonferroni Correction were used to identify significant differences in relative fluorescence accumulation at the cell plate or particles between KNOLLE and RAB11D, RAB11D and RAB2A, as well as RAB1A and RAB2A. *p < 0.05, ***p < 0.001, ****p < 0.0001. Other comparisons had no significant differences in their fluorescence intensity log ratios.

