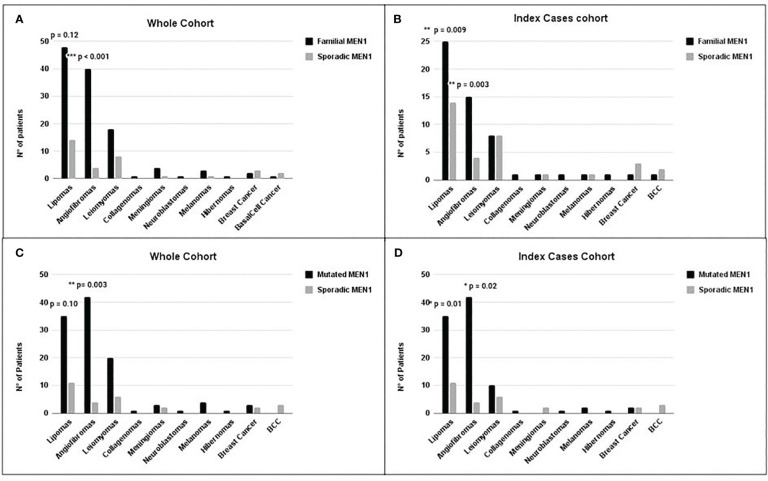
Figure 3.
Distribution of the main non-endocrine manifestations in MEN1 cohorts. Comparison between non-endocrine manifestations in the F-MEN1 vs. S-MEN1 in the whole cohort (A) and index cases (B) and in MEN1 mutation-positive vs. MEN1 mutation-negative in the whole cohort (C) and index cases (D). Statistical significance was determined by Fisher’s or chi-square test. *p < 0.05, **p < 0.01 and ***p < 0.001.

