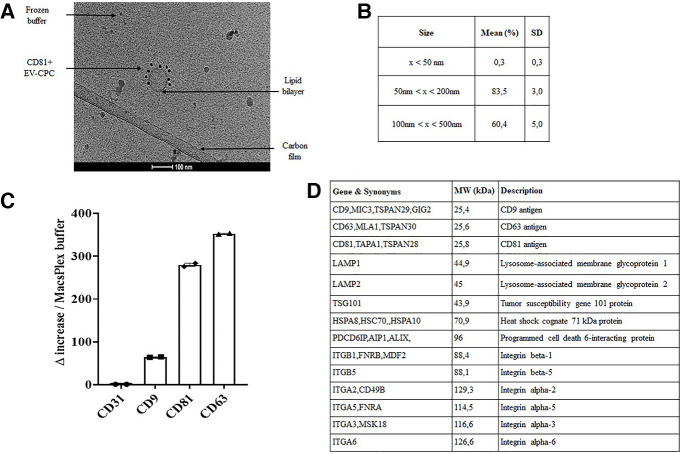
Figure 2.
EV-CPC characterization. (A) Cryo-TEM resolution of EV-CPC lipid bilayer membranes. Scale bar = 100 μm. (B) Size distribution of isolated particles by NTA analysis measured on 5 different preparations of EV-CPC. (C) FACS detection of tetraspanin expression on EV-CPC by MACSPlex analysis compared to a negative control, i.e., the CD31 endothelial marker (in technical duplicates; median +/− IQR). (D) Extract from the absolute quantification of proteomic analysis. SD: standard deviation; NTA: Nanoparticle Tracking Analysis; Cryo-TEM: immuno-gold labelling and cryo-transmission electron microscopy; CD: cluster of differentiation; MW: molecular weight.

