
Figure 3.
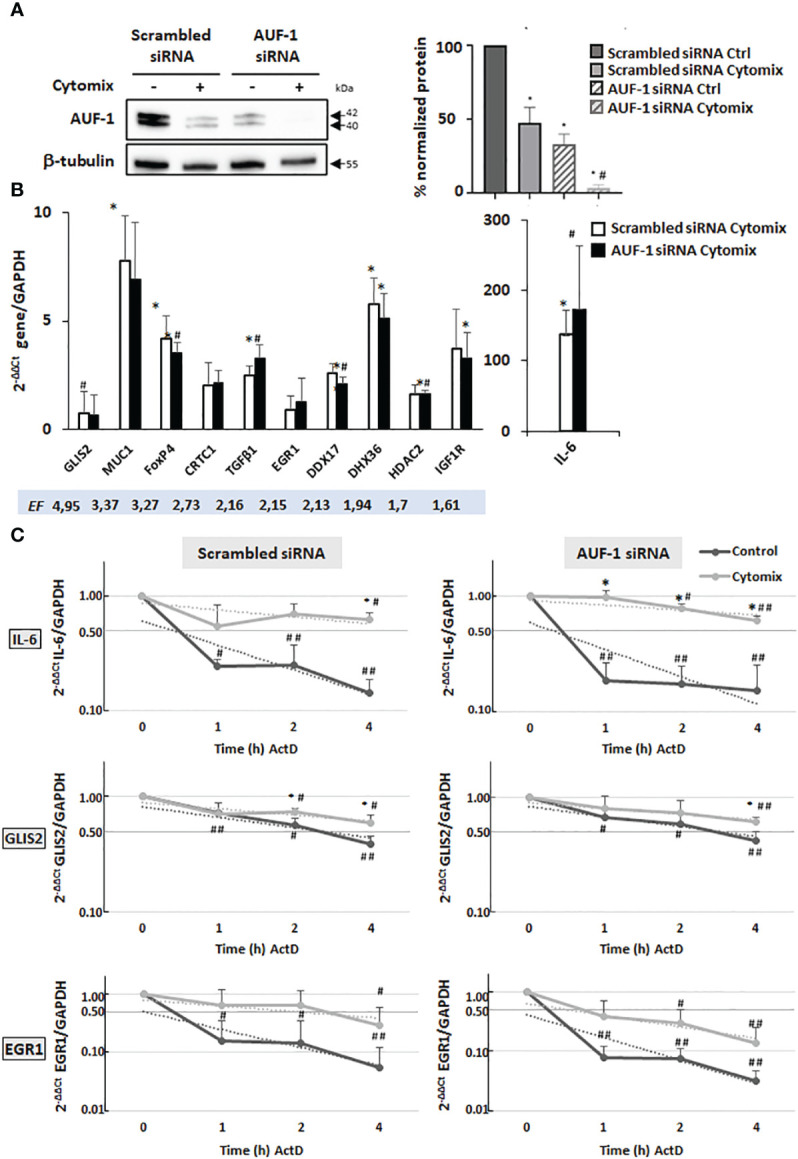
Analysis of AUF-1 target mRNA decay according to changes in AUF-1 intracellular levels. (A) Representative immunoblot (upper panel) and densitometric analysis (lower panel) of AUF-1 levels after transfection with scrambled siRNA or AUF-1 siRNA (48 h) and subsequent culture (48 h) with cytomix or medium control (mean ± SEM of n=3). β-tubulin was detected as the loading and normalization control. *p<0,05 compared to the scrambled-transfected medium control, #p<0,05 compared to AUF-1-siRNA (siAUF-1) control. (B) qRT-PCR analysis of steady-state mRNA expression of indicated AUF-1 targets, listed by decreasing EF, shown as housekeeping gene-normalized Ct value as fold change over unstimulated condition (2-ΔΔCt). *p<0,05 cytomix compared to the scrambled-transfected medium control, #p<0,05 compared to AUF-1-siRNA (siAUF-1) control. (C) qRT-PCR analysis (mean ± SEM of n=3) of mRNA decay rate of IL-6, a known AUF-1-regulated gene, and AUF-1 targets GLIS2 and EGR-1 upon treatment with actinomycin D (ActD) for indicated times after 48 h of cytomix stimulation (Time 0). Target mRNA expression levels were normalized to housekeeping mRNA (GAPDH) and expressed for each timepoint as fold change over time 0, as 2-ΔΔCt. *p<0,05 cytomix value vs corresponding unstimulated control value (CTRL in legend) at each datapoint; #p<0,05 and ##p<0.01 for ActD time points vs t=0 in each condition.